Cloud Computing (7): Cloud Operations and DevOps Practices
A working DevOps engineer's guide: CI/CD pipelines that gate quality, Terraform for reproducible infrastructure, Prometheus + Grafana monitoring, ELK/EFK logging, SRE error budgets, and the operational habits that keep services up at 3 AM.
In 2017 GitLab lost six hours of database state. An engineer, exhausted, ran rm -rf on the wrong server during an incident. The backup procedures had silently been broken for months; nobody noticed because no one was restoring from backups. The lesson is not “be careful with rm”. The lesson is that operations is a system — tools, runbooks, monitoring, automation, and the rituals around them. When the system is healthy, no single tired engineer can take down production. When the system is rotten, every late-night fix is one keystroke from disaster.
This article is about building that system. CI/CD that gates quality before code reaches users. Infrastructure as code so that “the production environment” is a Git revision, not a snowflake server. Monitoring that distinguishes signal from noise. Logs you can actually search. And the SRE practices — error budgets, SLOs, blameless postmortems — that turn ad-hoc firefighting into engineering.
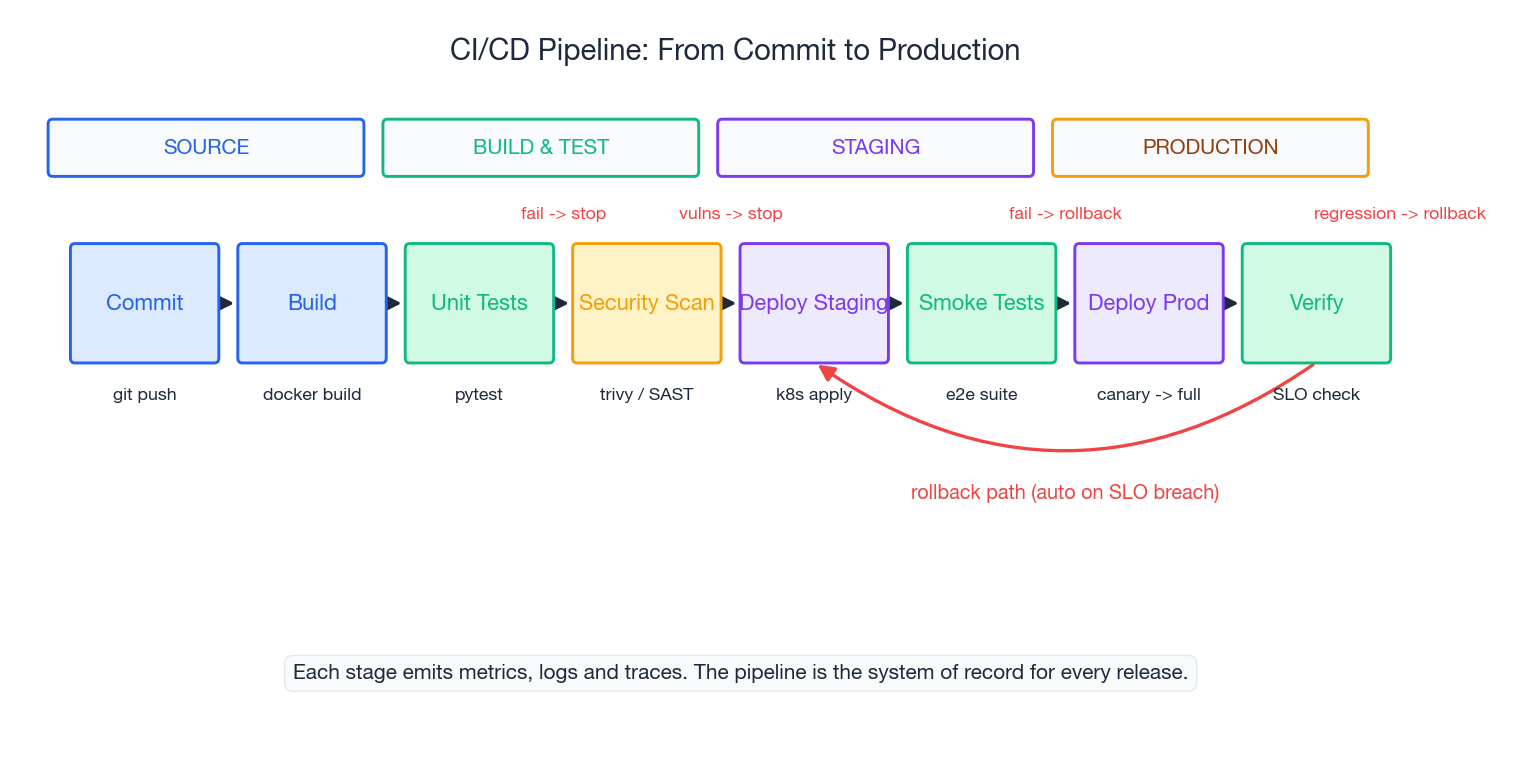
A modern CI/CD pipeline is not just “automation”. It is the only way code is allowed to reach production, which makes it the system of record for every release: who shipped what, with which tests passing, against which infrastructure version, and what happened next. Every other piece of the operations stack hangs off this spine.
name:deployon:push:branches:[main]permissions:id-token:write # OIDC for cloud authcontents:readpackages:writeenv:REGISTRY:ghcr.ioIMAGE:ghcr.io/${{ github.repository }}jobs:build-test:runs-on:ubuntu-lateststeps:- uses:actions/checkout@v4- name:Set up Gouses:actions/setup-go@v5with:{go-version-file:go.mod }- name:Lintuses:golangci/golangci-lint-action@v4- name:Unit testsrun:go test -race -coverprofile=coverage.out ./...- name:Coverage gaterun:| pct=$(go tool cover -func=coverage.out | tail -1 | awk '{print $3}' | tr -d '%')
echo "Coverage: ${pct}%"
if (( $(echo "$pct < 80" | bc -l) )); then
echo "::error::Coverage ${pct}% is below 80% threshold"
exit 1
fi- name:Build and push imagerun:| echo "${{ secrets.GITHUB_TOKEN }}" | docker login $REGISTRY -u ${{ github.actor }} --password-stdin
docker build -t $IMAGE:${{ github.sha }} -t $IMAGE:latest .
docker push $IMAGE --all-tagssecurity-scan:needs:build-testruns-on:ubuntu-lateststeps:- name:Trivy image scanuses:aquasecurity/trivy-action@masterwith:image-ref:${{ env.IMAGE }}:${{ github.sha }}severity:CRITICAL,HIGHexit-code:1# fail the build on critical CVEs- name:SAST with Semgrepuses:returntocorp/semgrep-action@v1with:config:p/owasp-top-tendeploy-staging:needs:security-scanruns-on:ubuntu-latestenvironment:stagingsteps:- uses:aws-actions/configure-aws-credentials@v4with:role-to-assume:arn:aws:iam::111122223333:role/deploy-stagingaws-region:us-east-1- name:Deploy to ECS stagingrun:| aws ecs update-service \
--cluster staging \
--service web \
--force-new-deployment \
--task-definition web:$(aws ecs describe-task-definition \
--task-definition web --query 'taskDefinition.revision')- name:Wait for stablerun:aws ecs wait services-stable --cluster staging --services websmoke-test:needs:deploy-stagingruns-on:ubuntu-lateststeps:- name:Health checkrun:| for i in {1..10}; do
status=$(curl -s -o /dev/null -w '%{http_code}' https://staging.example.com/healthz)
if [ "$status" = "200" ]; then echo "Healthy"; exit 0; fi
sleep 5
done
echo "::error::Staging health check failed after 50s"
exit 1- name:API contract testsrun:| npm ci
npx newman run tests/postman/smoke.json \
--environment tests/postman/staging.json \
--reporters cli,junit \
--reporter-junit-export results.xmldeploy-prod:needs:smoke-testruns-on:ubuntu-latestenvironment:production # requires manual approvalsteps:- uses:aws-actions/configure-aws-credentials@v4with:role-to-assume:arn:aws:iam::111122223333:role/deploy-prodaws-region:us-east-1- name:Canary deploy (10% traffic)run:| aws ecs update-service --cluster prod --service web \
--deployment-configuration '{
"deploymentCircuitBreaker": {"enable": true, "rollback": true},
"maximumPercent": 200,
"minimumHealthyPercent": 100
}' \
--force-new-deployment- name:Verify canary SLOs (5 min)run:| sleep 300
error_rate=$(aws cloudwatch get-metric-statistics \
--namespace Custom/Web --metric-name ErrorRate \
--start-time $(date -u -d '5 minutes ago' +%Y-%m-%dT%H:%M:%S) \
--end-time $(date -u +%Y-%m-%dT%H:%M:%S) \
--period 300 --statistics Average \
--query 'Datapoints[0].Average' --output text)
if (( $(echo "$error_rate > 1.0" | bc -l) )); then
echo "::error::Error rate ${error_rate}% exceeds 1% - triggering rollback"
aws ecs update-service --cluster prod --service web \
--task-definition web:$(( $(aws ecs describe-services --cluster prod \
--services web --query 'services[0].taskDefinition' --output text \
| grep -o '[0-9]*$') - 1 ))
exit 1
fi
Three design decisions worth calling out. First, OIDC replaces long-lived secrets — the id-token: write permission and role-to-assume mean no AWS access keys live in GitHub. Second, the production environment requires manual approval, creating a human checkpoint between staging success and prod deploy. Third, the canary has automated rollback — if the error rate exceeds 1% in the first five minutes, the pipeline rolls back without waiting for a human to wake up.
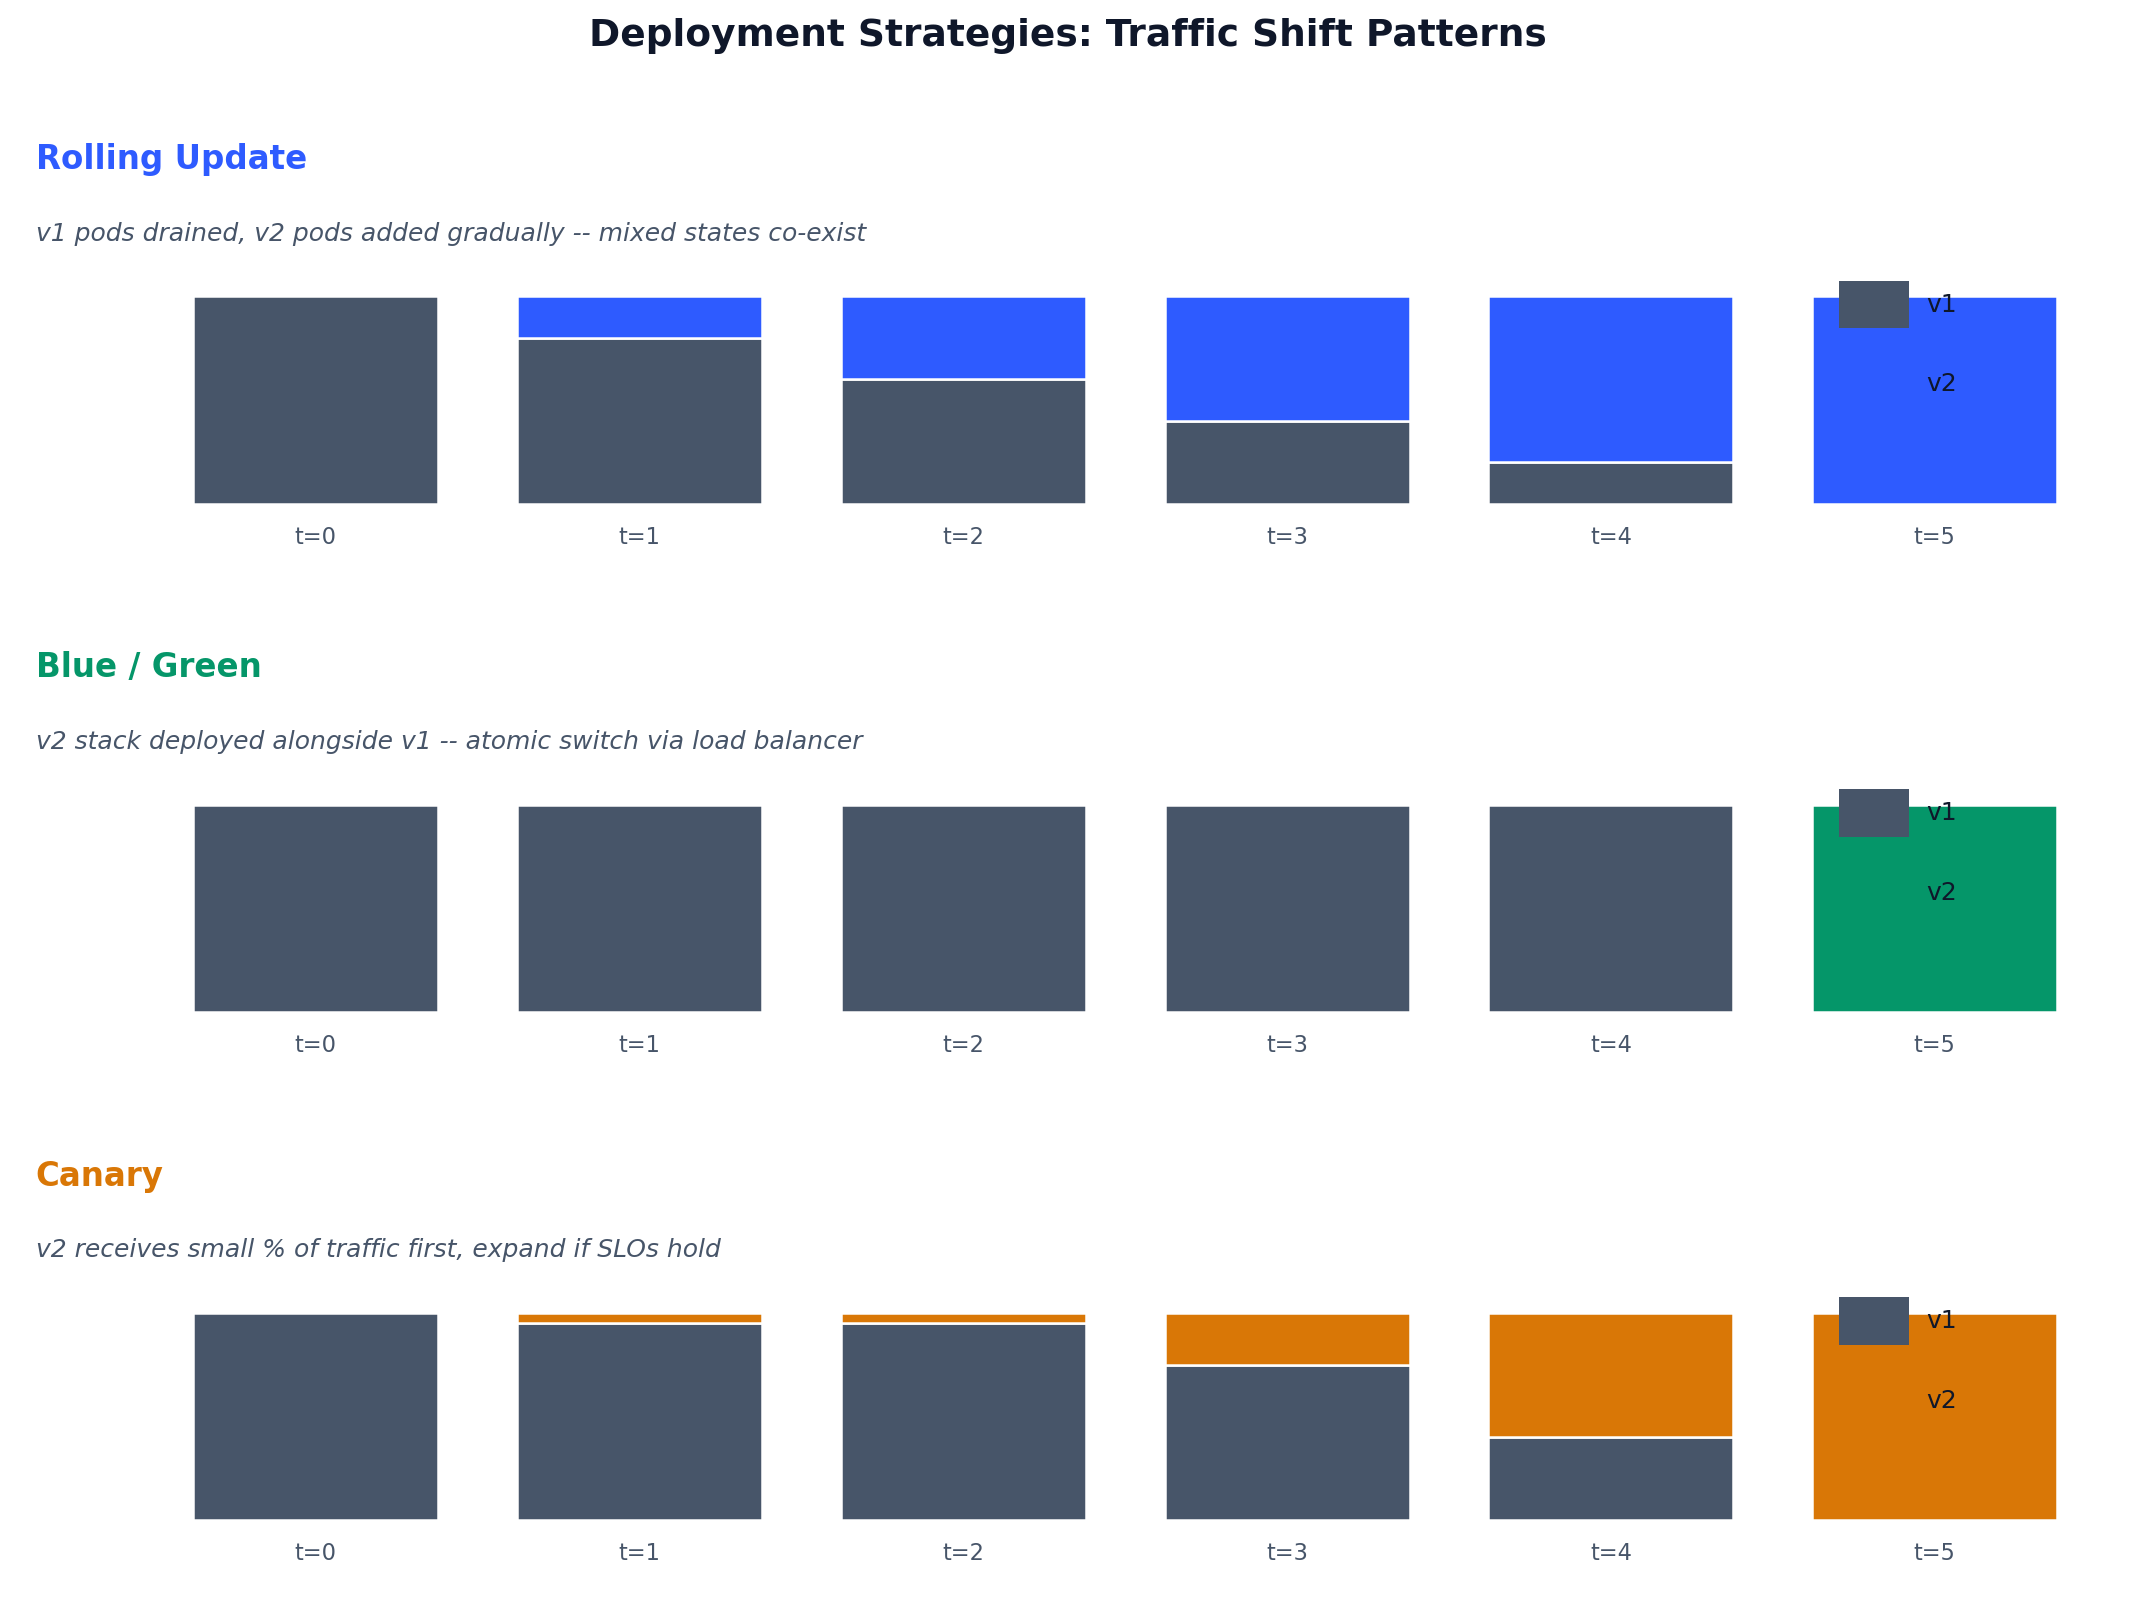
In practice you combine them. Deploy with canary; the canary itself uses feature flags to expose new behaviour to 1% of users; the feature flag service has its own blue/green deployment.
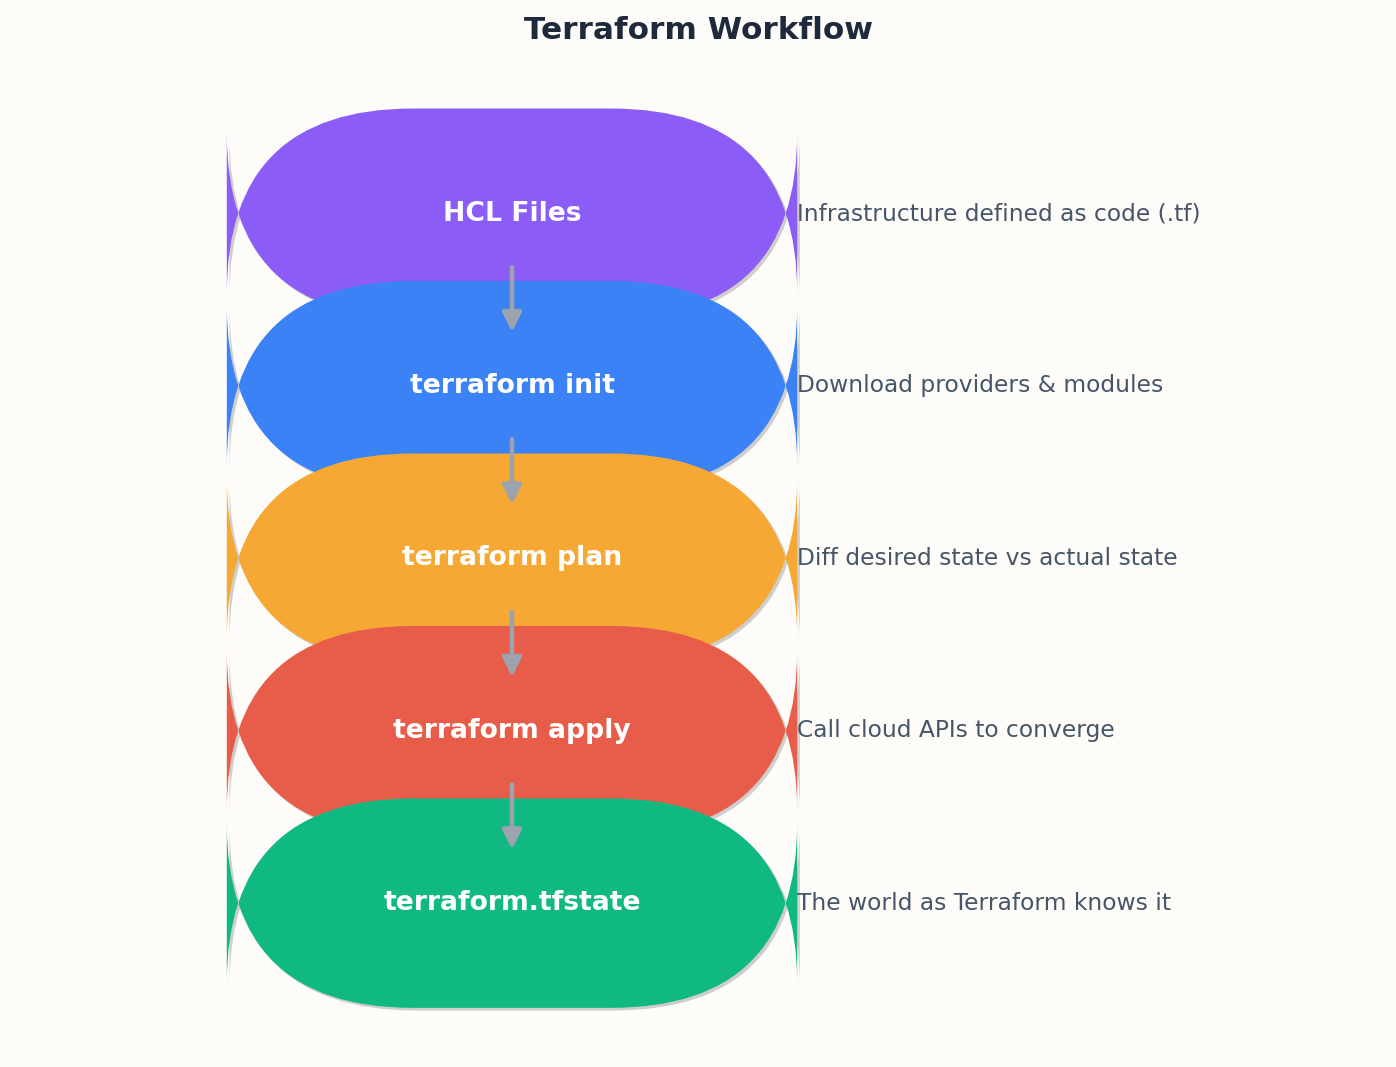
Infrastructure as code (IaC) means the production environment is described in version-controlled files, not in the memory of the person who clicked through the console last Tuesday. Terraform is the most widely adopted tool for this because it is provider-agnostic, declarative, and has a preview step (plan) that shows exactly what will change before anything changes.
terraform init # download providers, configure backend
terraform plan # preview: what will be created / changed / destroyed
terraform apply # make reality match the code
terraform destroy # tear it all down (non-prod only!)
plan is the part you actually live in. It tells you what will change before anything changes. Code review happens against the plan output, not just the HCL.
1
2
3
4
5
6
7
8
# Generate a plan file for CIterraform plan -out=tfplan -input=false# Show it in human-readable form for PR commentsterraform show -no-color tfplan > plan.txt
# Apply only the reviewed plan (no re-planning)terraform apply -input=false tfplan
Terraform’s state file (terraform.tfstate) is the map between your HCL code and the real resources in the cloud. Get state management wrong and you get drift, conflicts, and destroyed infrastructure.
Rules:
Remote backend with locking. S3 + DynamoDB on AWS, GCS on GCP, Terraform Cloud anywhere. Never commit state to Git — it contains secrets and causes merge conflicts.
One state file per service per environment.services/web/prod/, services/web/staging/, services/api/prod/. This limits blast radius and parallelises applies.
State encryption at rest. S3 server-side encryption is the minimum.
State access restricted to CI. Humans should run plan locally but apply only through the pipeline.
Modules are reusable, testable units of infrastructure. A well-designed module encapsulates a service pattern so that teams consume it without knowing the details.
Even with IaC, reality drifts. Someone clicks through the console to fix a production incident and forgets to backport the change. A scheduled drift check catches this before it compounds.
#!/bin/bash
# drift-check.sh -- run daily via cron or scheduled pipelineset -euo pipefail
SERVICES="web api worker"ENVS="staging prod"for svc in $SERVICES;dofor env in $ENVS;dodir="services/${svc}/${env}"echo"=== Checking ${dir} ==="cd"$dir" terraform init -backend=true -input=false > /dev/null
if ! terraform plan -detailed-exitcode -input=false > /dev/null 2>&1;thenecho"DRIFT DETECTED in ${dir}" terraform plan -no-color -input=false > "/tmp/drift-${svc}-${env}.txt"# Send to Slack / PagerDuty curl -X POST "$SLACK_WEBHOOK" -d "{\"text\":\"Drift detected in ${dir}. See attached plan.\"}"elseecho"No drift in ${dir}"ficd - > /dev/null
donedone
The -detailed-exitcode flag makes terraform plan return exit code 2 when changes are detected, which is what drives the conditional alert.
Monitoring with Prometheus, Grafana, and Alertmanager#
Every production system needs three pillars of observability: metrics (numbers over time), logs (events with context), and traces (request paths across services). This section covers metrics; the next covers logs.
Prometheus pulls metrics from your services, rather than having services push to it. This has two advantages: you can scrape a target from multiple Prometheus instances for HA, and a crashed service simply stops being scraped rather than leaving a dangling push connection.
packagemainimport("net/http""time""github.com/prometheus/client_golang/prometheus""github.com/prometheus/client_golang/prometheus/promhttp")var(httpDuration=prometheus.NewHistogramVec(prometheus.HistogramOpts{Name:"http_request_duration_seconds",Help:"Duration of HTTP requests.",Buckets:[]float64{.005,.01,.025,.05,.1,.25,.5,1,2.5,5,10},},[]string{"method","route","status"},)httpTotal=prometheus.NewCounterVec(prometheus.CounterOpts{Name:"http_requests_total",Help:"Total number of HTTP requests.",},[]string{"method","route","status"},))funcinit(){prometheus.MustRegister(httpDuration,httpTotal)}funcinstrumentHandler(routestring,nexthttp.HandlerFunc)http.HandlerFunc{returnfunc(whttp.ResponseWriter,r*http.Request){start:=time.Now()rw:=&responseWriter{ResponseWriter:w,statusCode:200}next(rw,r)duration:=time.Since(start).Seconds()status:=http.StatusText(rw.statusCode)httpDuration.WithLabelValues(r.Method,route,status).Observe(duration)httpTotal.WithLabelValues(r.Method,route,status).Inc()}}funcmain(){http.Handle("/metrics",promhttp.Handler())http.HandleFunc("/api/orders",instrumentHandler("/api/orders",handleOrders))http.ListenAndServe(":8080",nil)}
Alerting rules that do not wake people up for nothing#
The goal is zero false-positive pages. Every alert that fires should require human action. If it does not, it should be a dashboard panel, not a page.
# alerts/slo.ymlgroups:- name:slo-burn-raterules:# Multi-window, multi-burn-rate alerting (Google SRE Workbook pattern)# Fast burn: 14.4x in 1h AND 6x in 6h- alert:HighErrorBurnRate_Criticalexpr:| (
sum(rate(http_requests_total{status=~"5.."}[1h]))
/ sum(rate(http_requests_total[1h]))
) > (14.4 * 0.001)
and
(
sum(rate(http_requests_total{status=~"5.."}[6h]))
/ sum(rate(http_requests_total[6h]))
) > (6 * 0.001)for:2mlabels:severity:criticalteam:platformannotations:summary:"Error budget burning fast -- will exhaust in < 1 day"runbook:"https://wiki.internal/runbooks/high-error-rate"dashboard:"https://grafana.internal/d/slo-overview"# Slow burn: 3x in 1d AND 1x in 3d- alert:HighErrorBurnRate_Warningexpr:| (
sum(rate(http_requests_total{status=~"5.."}[1d]))
/ sum(rate(http_requests_total[1d]))
) > (3 * 0.001)
and
(
sum(rate(http_requests_total{status=~"5.."}[3d]))
/ sum(rate(http_requests_total[3d]))
) > (1 * 0.001)for:15mlabels:severity:warningteam:platformannotations:summary:"Error budget burning slowly -- will exhaust in < 10 days"runbook:"https://wiki.internal/runbooks/high-error-rate"- alert:HighLatency_P99expr:| histogram_quantile(0.99, sum(rate(http_request_duration_seconds_bucket[5m])) by (le, service))
> 2.0for:10mlabels:severity:warningannotations:summary:"P99 latency above 2s for {{ $labels.service }}"runbook:"https://wiki.internal/runbooks/high-latency"
The multi-window, multi-burn-rate pattern from the Google SRE Workbook is the single most important improvement you can make to alerting. Instead of alerting on “error rate > 1%”, which fires on any brief spike, it alerts on “the rate at which we are consuming our error budget”. A 2% error rate for 30 seconds barely moves the monthly budget; a 0.5% error rate sustained for 3 days consumes it entirely. The burn-rate approach catches both.
Metrics tell you that something is wrong. Logs tell you why. A centralised logging stack collects, processes, indexes, and retains logs from every service in one searchable store.
The two dominant stacks are ELK (Elasticsearch, Logstash, Kibana) and EFK (Elasticsearch, Fluentd/Fluent Bit, Kibana). The difference is the shipper: Logstash is JVM-based and powerful but heavy; Fluent Bit is C-based, lightweight, and runs well as a DaemonSet.
The single most impactful thing you can do for log searchability is to log in JSON. A structured log entry is a queryable document; an unstructured one is a string you have to regex-parse.
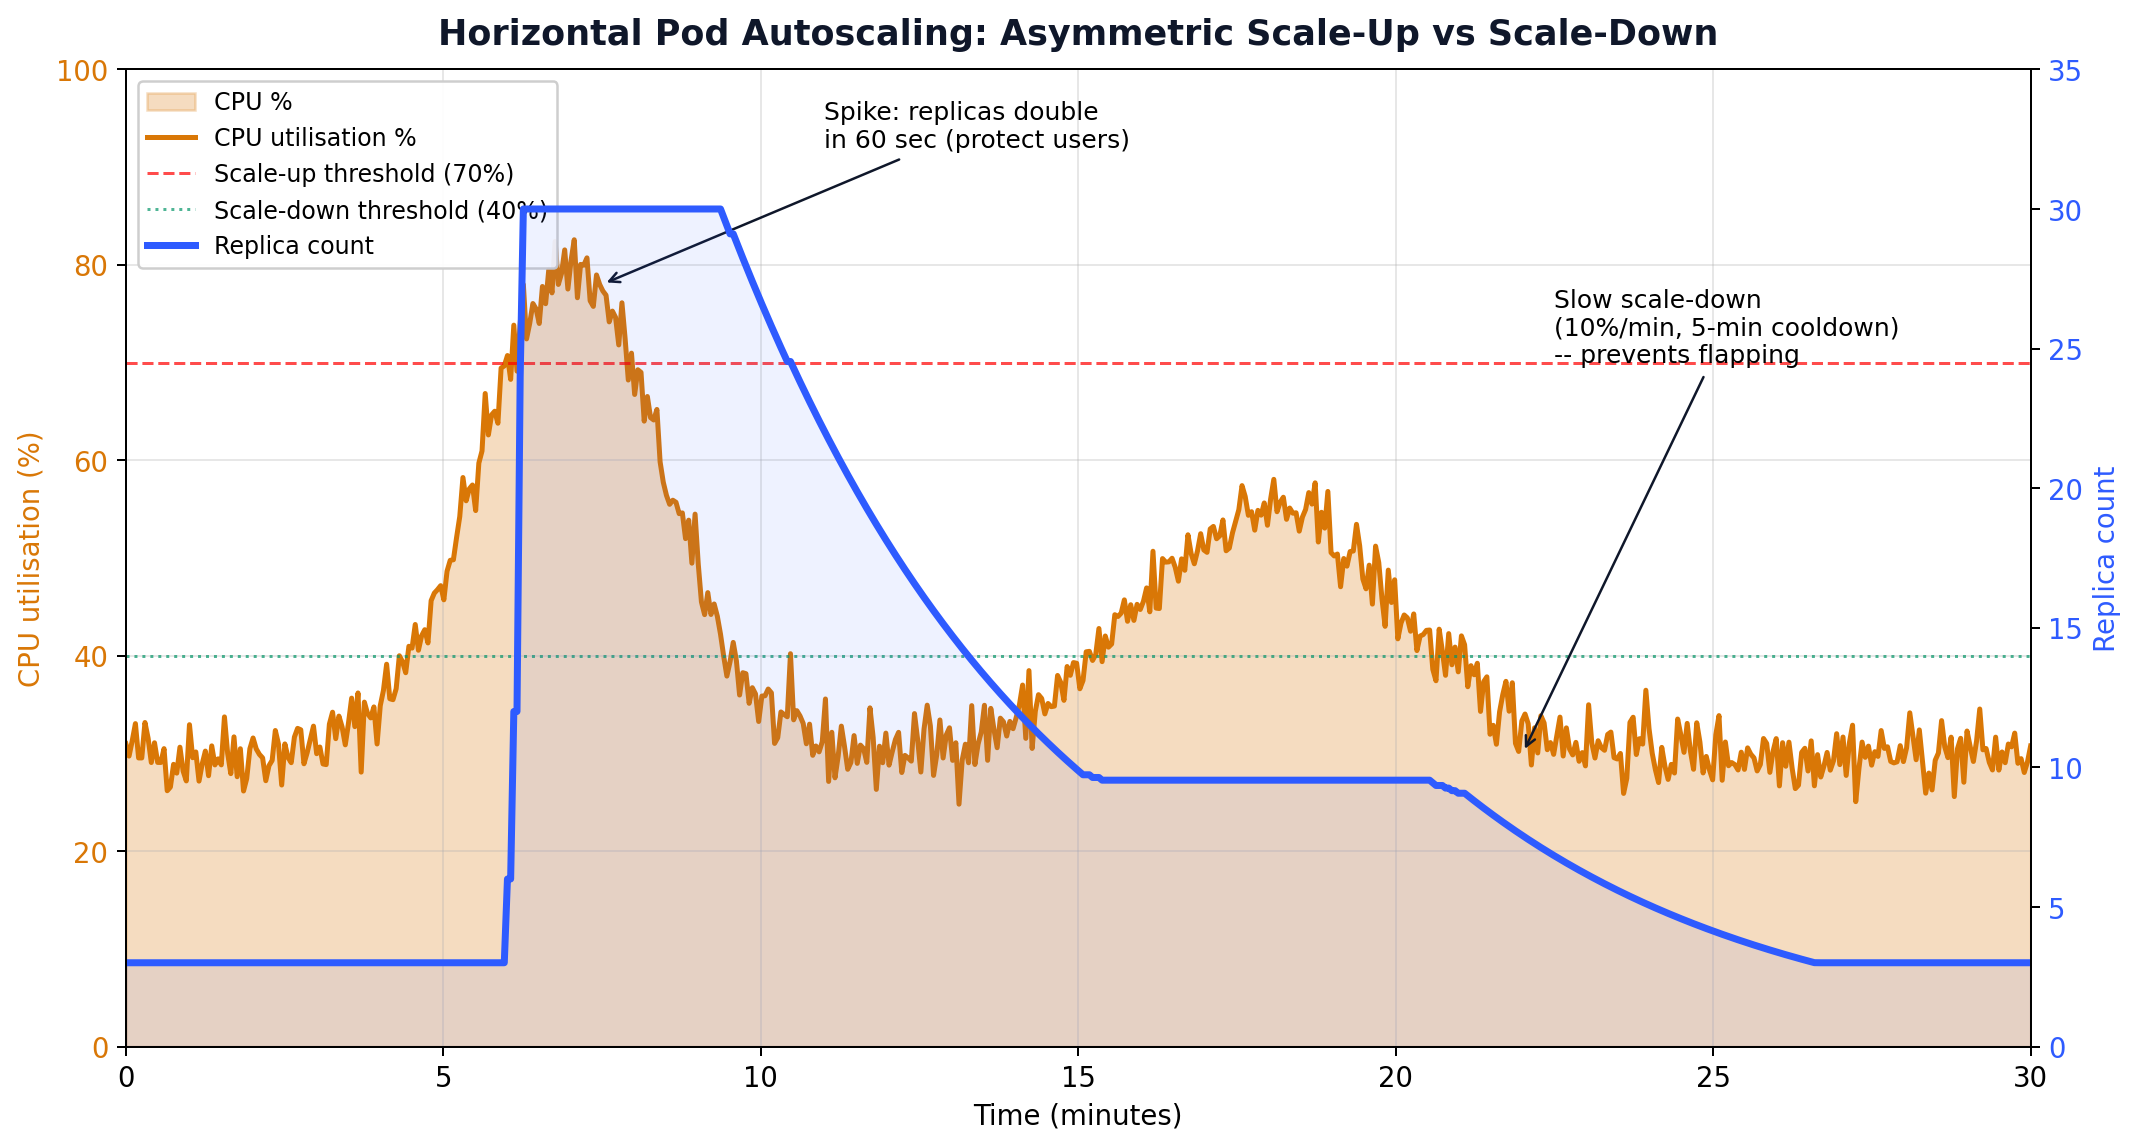
Auto-scaling sounds simple: add capacity when load increases, remove it when load decreases. In practice, getting it right requires choosing the right signal, tuning the response speed, and preventing flapping.
apiVersion:autoscaling/v2kind:HorizontalPodAutoscalermetadata:name:web-hpaspec:scaleTargetRef:apiVersion:apps/v1kind:Deploymentname:webminReplicas:3maxReplicas:50behavior:scaleUp:stabilizationWindowSeconds:60# wait 1 min before scaling uppolicies:- type:Percentvalue:100# double at mostperiodSeconds:60scaleDown:stabilizationWindowSeconds:300# wait 5 min before scaling downpolicies:- type:Percentvalue:10# remove at most 10% per periodperiodSeconds:60metrics:- type:Resourceresource:name:cputarget:type:UtilizationaverageUtilization:70- type:Podspods:metric:name:http_requests_per_secondtarget:type:AverageValueaverageValue:"1000"
The asymmetric scale-up/scale-down behaviour is deliberate. Scaling up fast (double in 60 seconds) protects user experience during traffic spikes. Scaling down slowly (10% per minute, after a 5-minute cooldown) prevents the “sawtooth” pattern where the autoscaler repeatedly scales down too aggressively, triggers high CPU, scales back up, and oscillates.
For workloads with predictable patterns (e.g., a retail site that peaks every day at noon), reactive scaling is always late. By the time CPU hits 70%, users are already experiencing latency. AWS predictive scaling and GCP scheduled scaling address this:
The SchedulingBufferTime of 300 seconds means instances are launched 5 minutes before the predicted spike, so they are warmed up and passing health checks by the time traffic arrives.
Cost Optimisation Without Rewriting Your Application#
Cloud bills surprise everyone eventually. The good news is that 30-50% of most cloud bills can be cut without changing application code — it is about rightsizing, scheduling, and commitment.
Work from top to bottom; each layer has higher impact and lower effort than the one below it:
Turn off what you are not using. Idle dev/staging environments running 24/7, orphaned EBS volumes, unattached Elastic IPs, load balancers fronting zero targets.
Schedule non-production. Dev clusters do not need to run at 3 AM. Save 65% by running them 10 hours/day, 5 days/week.
Rightsize. Most instances are 2-4x oversized. Use CloudWatch / Cloud Monitoring data to find instances where CPU and memory never exceed 20%.
Use Spot/Preemptible for fault-tolerant workloads. CI runners, batch jobs, dev environments. Savings of 60-90%.
Commit with Reserved Instances / Savings Plans. For steady-state production, 1-year no-upfront commitments save 30-40% with minimal risk.
Storage tiering. Move infrequently accessed data to cheaper tiers (S3 Infrequent Access, Glacier, Archive).
Site Reliability Engineering is the practice of treating operations as a software engineering problem. The key tools are SLOs, error budgets, and blameless postmortems.
SLI (Service Level Indicator): a quantitative measure of service behaviour. “The proportion of requests that complete in under 300ms.”
SLO (Service Level Objective): a target for the SLI. “99.9% of requests complete in under 300ms over a rolling 30-day window.”
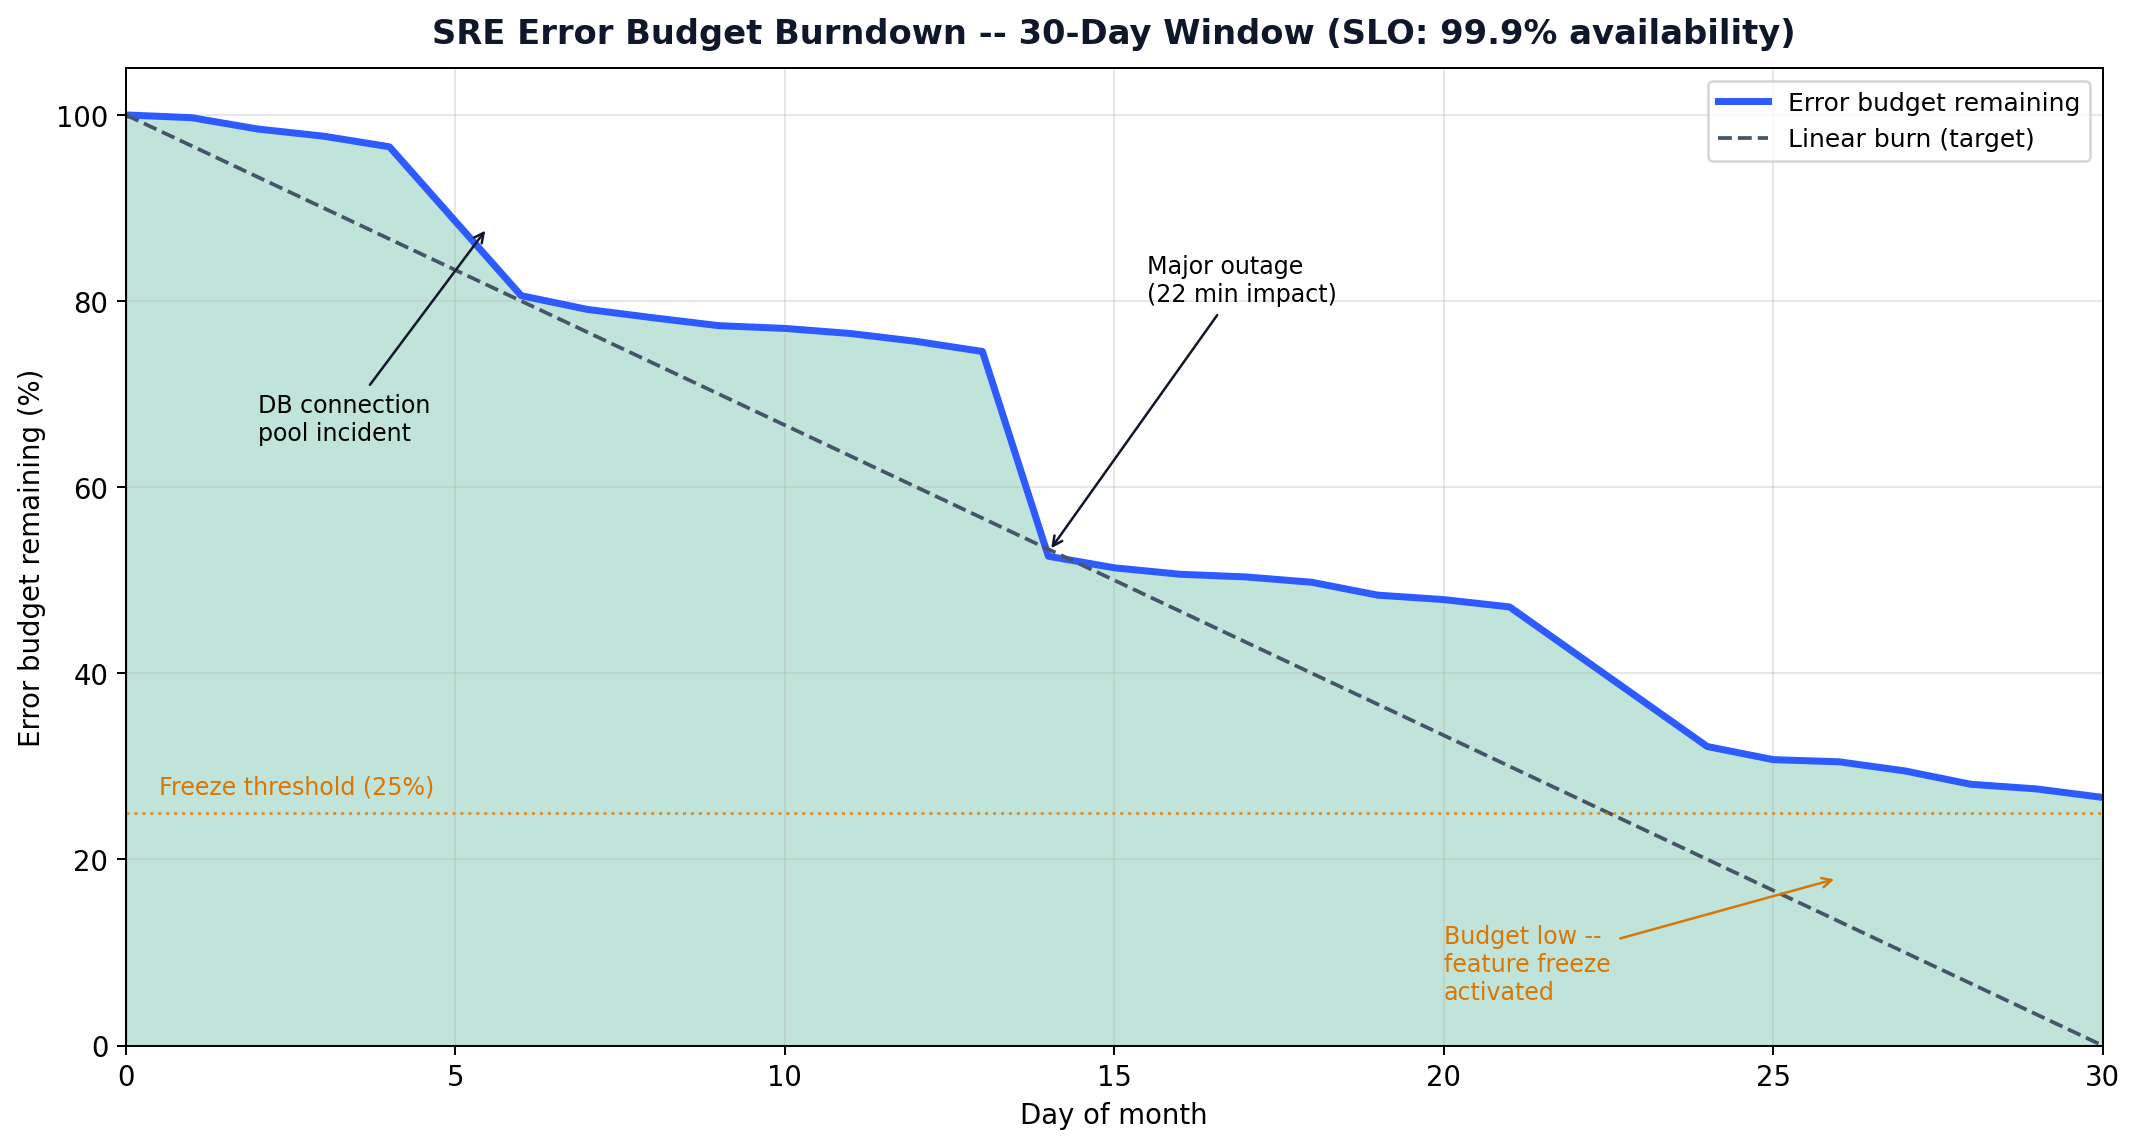
Error budget: the inverse of the SLO. If your SLO is 99.9%, your error budget is 0.1% — you are allowed 43 minutes of downtime per month.
The error budget is a management tool, not just a metric. When the budget is healthy, teams ship features fast. When the budget is low, teams freeze features and focus on reliability. This replaces the perennial “move fast vs. be stable” argument with a number everyone can see.
## Incident Report: [Title]
**Date**: YYYY-MM-DD
**Duration**: X hours Y minutes
**Severity**: SEV-1 / SEV-2 / SEV-3
**Author**: [name]
**Reviewers**: [names]
### Summary
One paragraph: what happened, what was the user impact, how was it resolved.
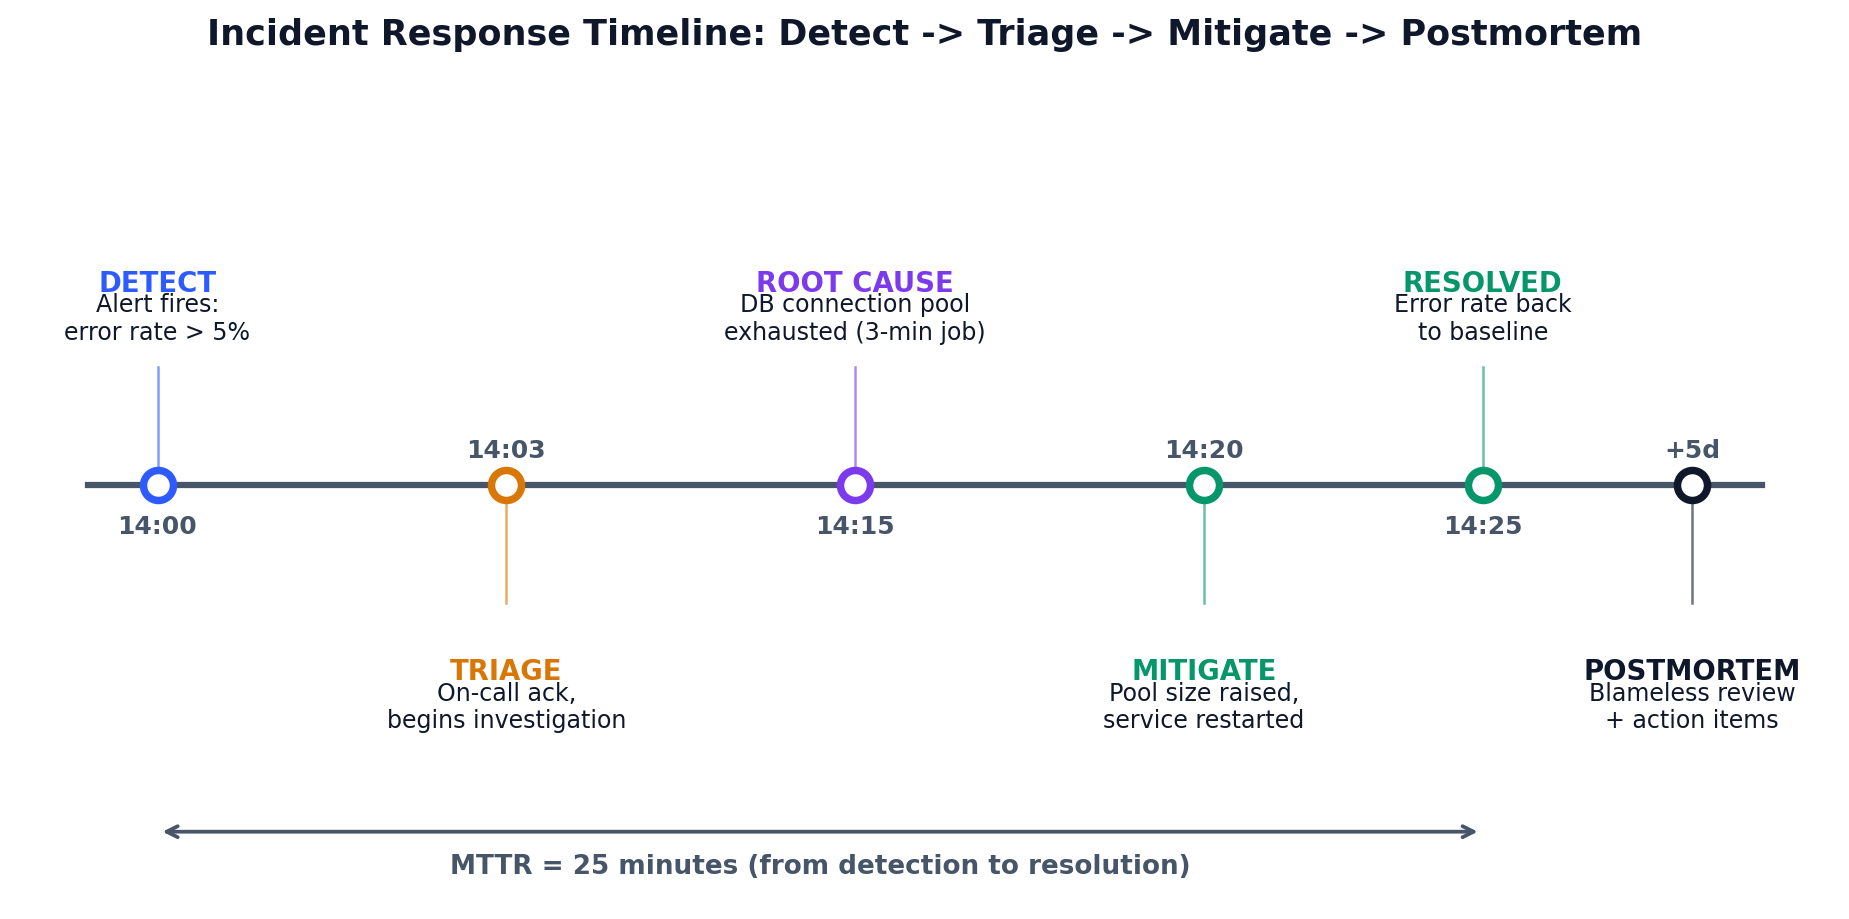
### Timeline (all times UTC)
- 14:00 - Monitoring alert fires: error rate > 5%
- 14:03 - On-call engineer acknowledges, begins investigation
- 14:15 - Root cause identified: database connection pool exhausted
- 14:20 - Mitigation applied: increased pool size, restarted service
- 14:25 - Error rate returns to baseline
- 14:30 - Incident declared resolved
### Root cause
The connection pool was sized for 50 connections. A new batch job,
deployed two days prior, held connections for 30 seconds instead of
the expected 100ms, exhausting the pool during peak traffic.
### Impact
- 25 minutes of elevated error rates (peak 12%)
- ~3,200 failed requests
- No data loss
### What went well
- Alert fired within 3 minutes of the problem starting
- On-call engineer had the right access to diagnose and mitigate
### What went poorly
- The batch job was not load-tested against the shared database
- The connection pool had no circuit breaker
### Action items
| Action | Owner | Priority | Due date |
|--------|-------|----------|----------|
| Add connection pool metrics to dashboard | Alice | P1 | 2024-02-01 |
| Load-test batch jobs against shared resources | Bob | P1 | 2024-02-15 |
| Implement connection pool circuit breaker | Carol | P2 | 2024-03-01 |
| Add runbook for connection pool exhaustion | Dave | P2 | 2024-02-01 |
The action items are the entire point. A postmortem without action items is just a story.
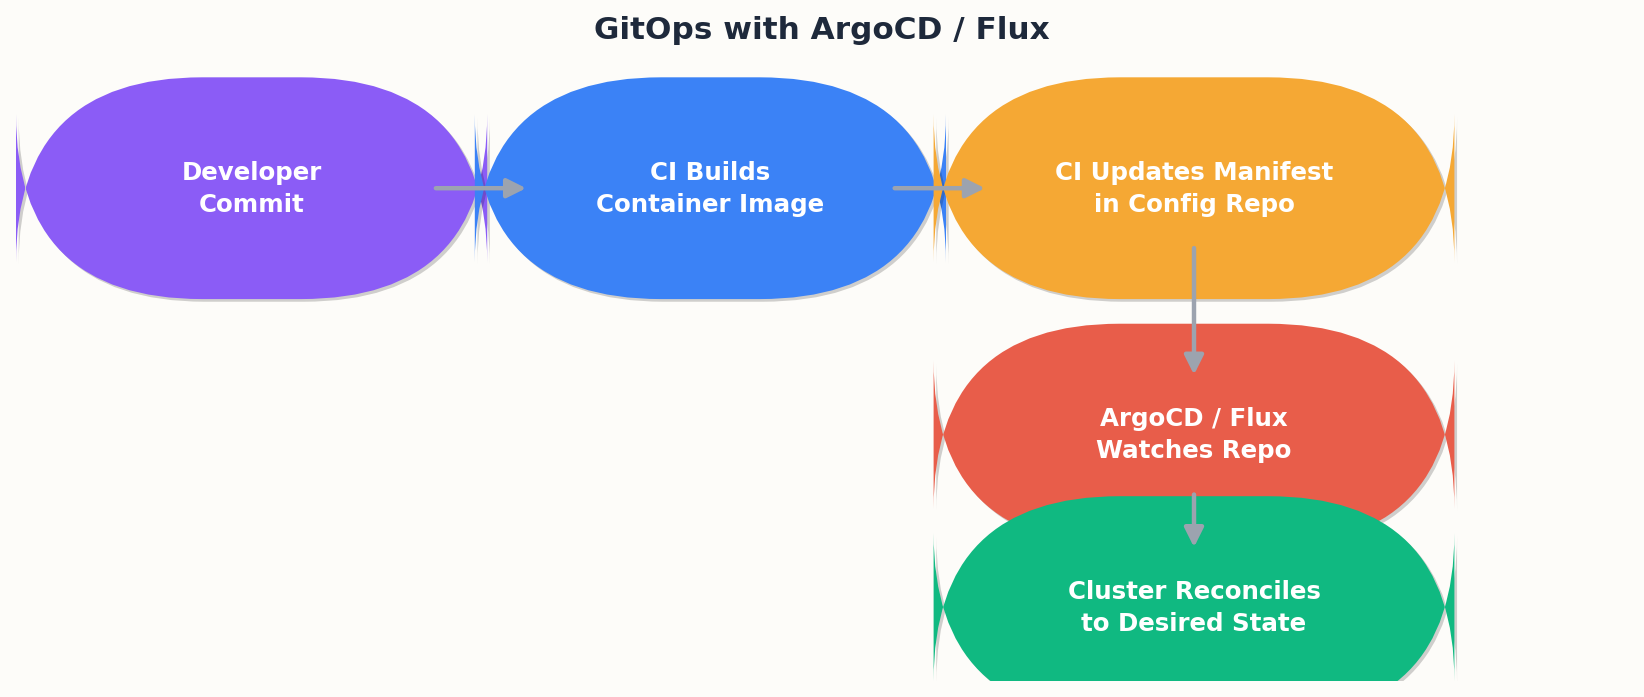
GitOps removes a whole class of mistakes by removing a whole class of capabilities. Nobody runs kubectl apply against production. The cluster reconciles itself to whatever is in the config repo, and the only way to change the cluster is to change Git.
This Kustomize-based layout gives you DRY base manifests with environment-specific patches. A PR that changes apps/web/overlays/production/ is a production change — it gets the same review scrutiny as application code.
# 1. What is the symptom? Check the dashboard.open https://grafana.internal/d/overview
# 2. Is it one service or everything?kubectl get pods -A | grep -v Running
kubectl top nodes
kubectl top pods --sort-by=cpu -A | head -20
# 3. What changed recently?kubectl rollout history deployment/web -n production
git log --oneline --since="2 hours ago" -- apps/web/
# 4. Check resource pressurekubectl describe nodes | grep -A5 "Conditions:"df -h # diskfree -m # memoryss -tlnp # open ports / connection counts# 5. Read the logs for the affected servicekubectl logs -l app=web -n production --tail=100 --since=5m
# PostgreSQL: slow queries right nowSELECT pid, now() - pg_stat_activity.query_start AS duration,
query, state, wait_event_type, wait_event
FROM pg_stat_activity
WHERE state !='idle' AND (now() - pg_stat_activity.query_start) > interval '5 seconds'ORDER BY duration DESC;# PostgreSQL: connection count by stateSELECT state, count(*)FROM pg_stat_activity
GROUP BY state;# PostgreSQL: table bloat checkSELECT schemaname, tablename,
pg_size_pretty(pg_total_relation_size(schemaname ||'.'|| tablename)) as total_size,
n_dead_tup,
n_live_tup,
ROUND(n_dead_tup * 100.0 / NULLIF(n_live_tup + n_dead_tup, 0), 2) as dead_pct
FROM pg_stat_user_tables
WHERE n_dead_tup > 10000ORDER BY n_dead_tup DESC;# MySQL: current queriesSHOW FULL PROCESSLIST;# MySQL: InnoDB status (locks, deadlocks, buffer pool)SHOW ENGINE INNODB STATUS\G# Redis: memory and key statsredis-cli INFO memory
redis-cli INFO keyspace
redis-cli --bigkeys # find large keysredis-cli SLOWLOG GET 10# recent slow commands
Every change reaches production via the pipeline; no manual apply.
OIDC for cloud auth, no long-lived secrets.
Quality gates fail builds; nobody bypasses with admin override.
Automated rollback on SLO breach.
Infrastructure
All resources defined in Terraform / equivalent IaC.
Remote state with locking; one state file per service per environment.
terraform plan posted on every PR; review the plan, not just the HCL.
Drift detection runs at least daily.
Monitoring
Metrics, logs, traces all flowing.
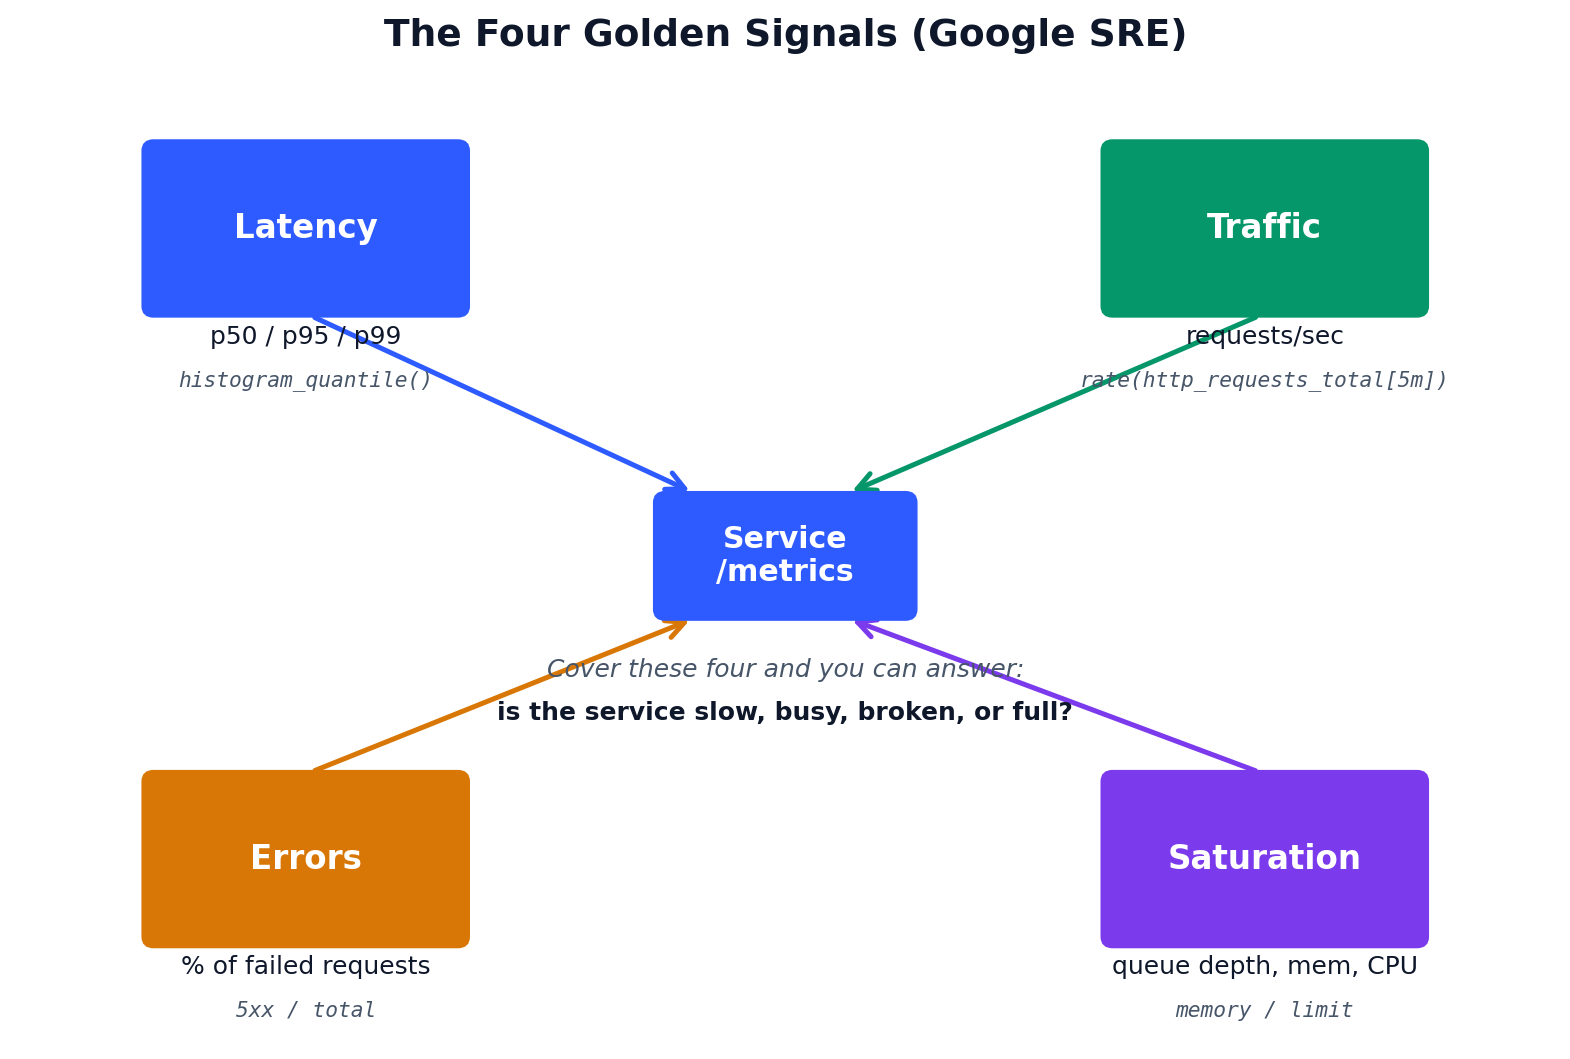
Dashboards exist for every service with the four golden signals (latency, traffic, errors, saturation).
Alerts based on burn rate, not raw thresholds.
Every alert has a runbook URL; no runbook -> no alert.
Logging
JSON structured logs from every service.
Request ID propagated end-to-end.
Retention tiers configured; old indices roll off automatically.
Sensitive fields scrubbed before write.
SRE
SLOs published per service, with executive sign-off.
Error budget visible on the team dashboard.
On-call rotation with documented escalation.
Postmortems for all SEV-1 / SEV-2 incidents within 5 business days.
Cost
Tags on every resource; cost dashboard split by team.
Auto-shutdown of non-prod outside business hours.
Monthly review of idle / oversized resources.
The pattern: every box on this list is something that, if missing, will cost you a week of incident response and a chunk of executive trust the first time it bites. The work to add them is small; the savings are large; the only obstacle is the day it becomes urgent enough to stop putting off.