
Linux (7): Process and Resource Management: From `top` to cgroups
How processes are born and die on Linux: the fork/exec model, the state machine that ps and top print in the STAT column, the resource axes (CPU, memory, disk I/O, network) that actually constrain a server, the signals you should know by heart, and the cgroup + namespace primitives that turn all of this into containers.

The job of a Linux operator is rarely “memorise more commands”. It is to take a fuzzy symptom — the site feels slow, the API timed out, the box is unresponsive — and quickly map it to the right axis: is the CPU saturated, is memory being eaten by cache (which is fine) or by a runaway process (which is not), is the disk queue full, is some socket leaking? Once the axis is named, the tool follows almost mechanically.
This post walks the full picture in that order. We start from how a process actually comes to exist (fork() + exec()), the state machine the kernel pushes it through, and the four resource axes that bound everything it can do. Then we build up the toolchain — top / htop / ps / pstree / lsof / ss / iostat — not as a command list but as a layered way of looking at the same system. Finally we cover the things you do to a process: signals, background jobs, nice/renice priorities, and the cgroup + namespace mechanisms that quietly underpin every container you have ever run.
Process, program, thread — and why the distinction matters#
These three terms are used interchangeably in casual conversation, but the kernel treats them very differently:
| Term | What it is | Identifier |
|---|---|---|
| Program | A static file on disk (/usr/bin/vim) — instructions plus data layout | inode + path |
| Process | A running instance of a program: own address space, file descriptors, PID | PID, parent PPID |
| Thread | An execution flow inside a process, sharing its address space | TID (kernel task_struct) |
A process is what you bill resources against — memory pages, file descriptors, open sockets all live in the process. A thread is just another schedulable entity that happens to share that state with its siblings. On Linux this distinction is unusually thin: both processes and threads are task_struct to the kernel; they only differ in what they share when created (clone() flags decide). That is why ps -eLf lists threads with the same PID but different LWP values, and why a multi-threaded JVM shows up as one process with hundreds of task_structs underneath.
A few invariants worth keeping in mind:
- Every process has a parent. PPID 0 is reserved for the kernel; PPID 1 is
systemd(orinit), the only userspace process the kernel itself starts. Walk PPIDs up far enough and you always hit 1. - Processes are isolated by default: address spaces don’t overlap, opening a file in process A does nothing to process B. Sharing requires explicit IPC (pipes, sockets, shared memory, signals).
- Processes are dynamic: they are created, scheduled, blocked, woken, and torn down constantly. A healthy server churns thousands of short-lived processes per minute; that is normal.
How processes are born: fork() and exec()#
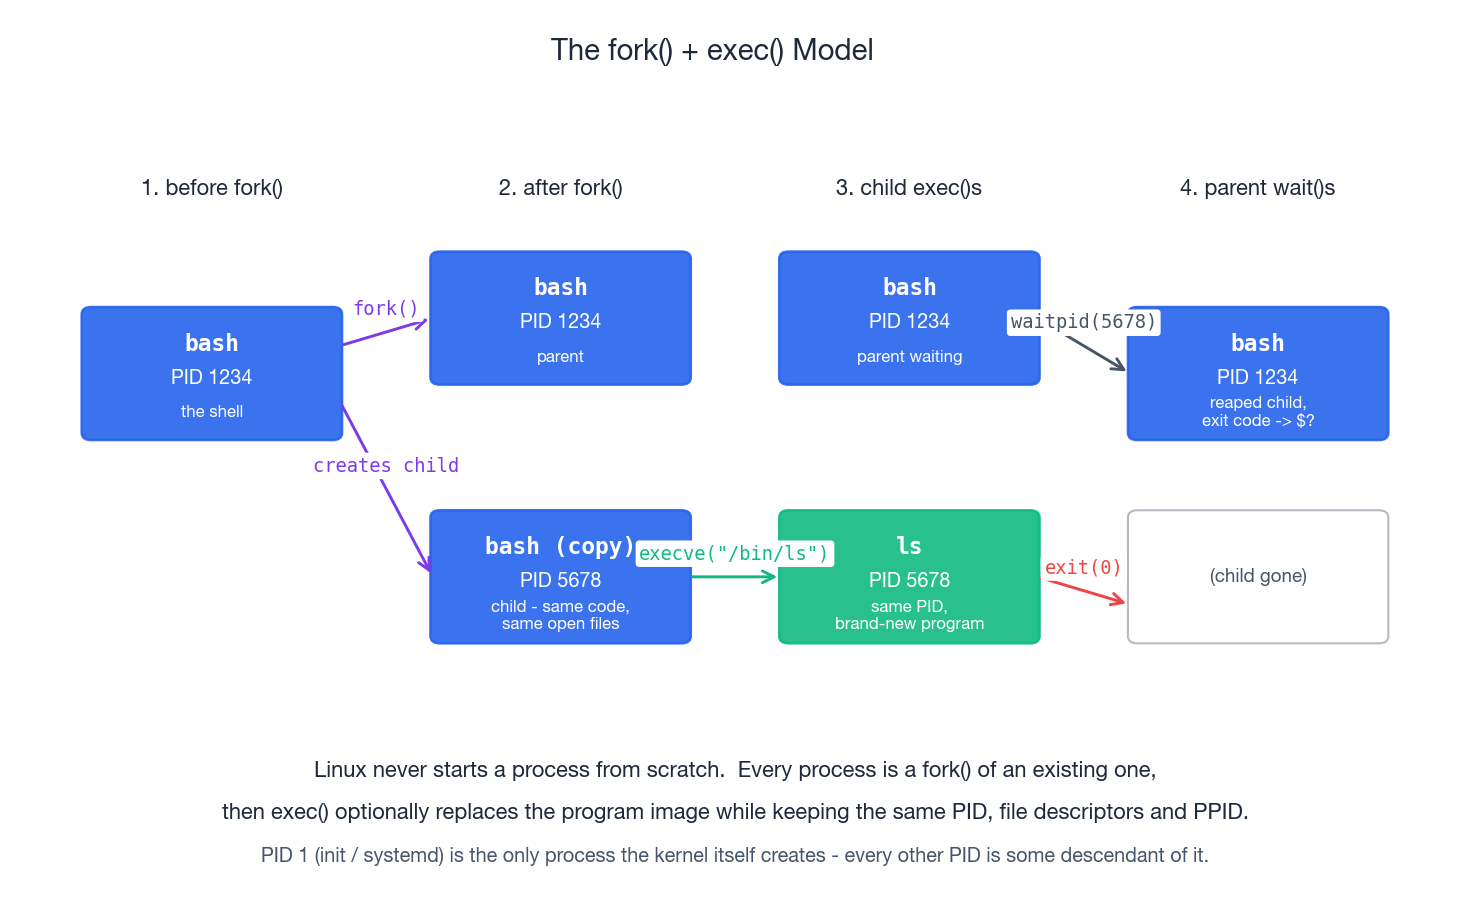
Linux has exactly one mechanism for creating a new process: fork. fork() (or its modern cousin clone()) duplicates the calling process. Right after the call you have two near-identical processes returning from the same line of code; the only difference is the return value (0 in the child, the child’s PID in the parent). They share open file descriptors, the same code, the same heap contents — initially even the same memory pages, thanks to copy-on-write.
That alone would just multiply the same program. The second half of the trick is exec. Inside the freshly forked child, calling execve("/bin/ls", argv, envp) tells the kernel to replace the current program image with a different binary while keeping the same PID, the same PPID, and (by default) the same file descriptors. So when you type ls at a shell prompt, what actually happens is:
- The shell calls
fork(). Now there are two shells. - The child calls
execve("/bin/ls", ...). Its program image becomesls. - The parent (the original shell) calls
waitpid()to block until the child exits, then collects the exit code into$?.
This split between “create a process” and “load a program” is what makes shell pipelines, redirection, environment manipulation, and setuid-style privilege drops possible. Each of those happens between fork and exec, in the child, before the new program even starts.
Two consequences of this design show up constantly:
- Inherited file descriptors. A child inherits all open FDs of the parent unless they are marked
O_CLOEXEC. That is whycmd > log.txtworks: the shell opens the file as FD 1 in the child before exec-ing the command. It is also why a leaking daemon can pin deleted files (we’ll come back to that). - PID 1 is special. If a process exits while it still has children, those orphans get re-parented to PID 1, which is responsible for
wait()-ing on them. A container’s PID 1 has the same job — and if you forget to handle it, you get the famous “zombies in my Docker container” problem.
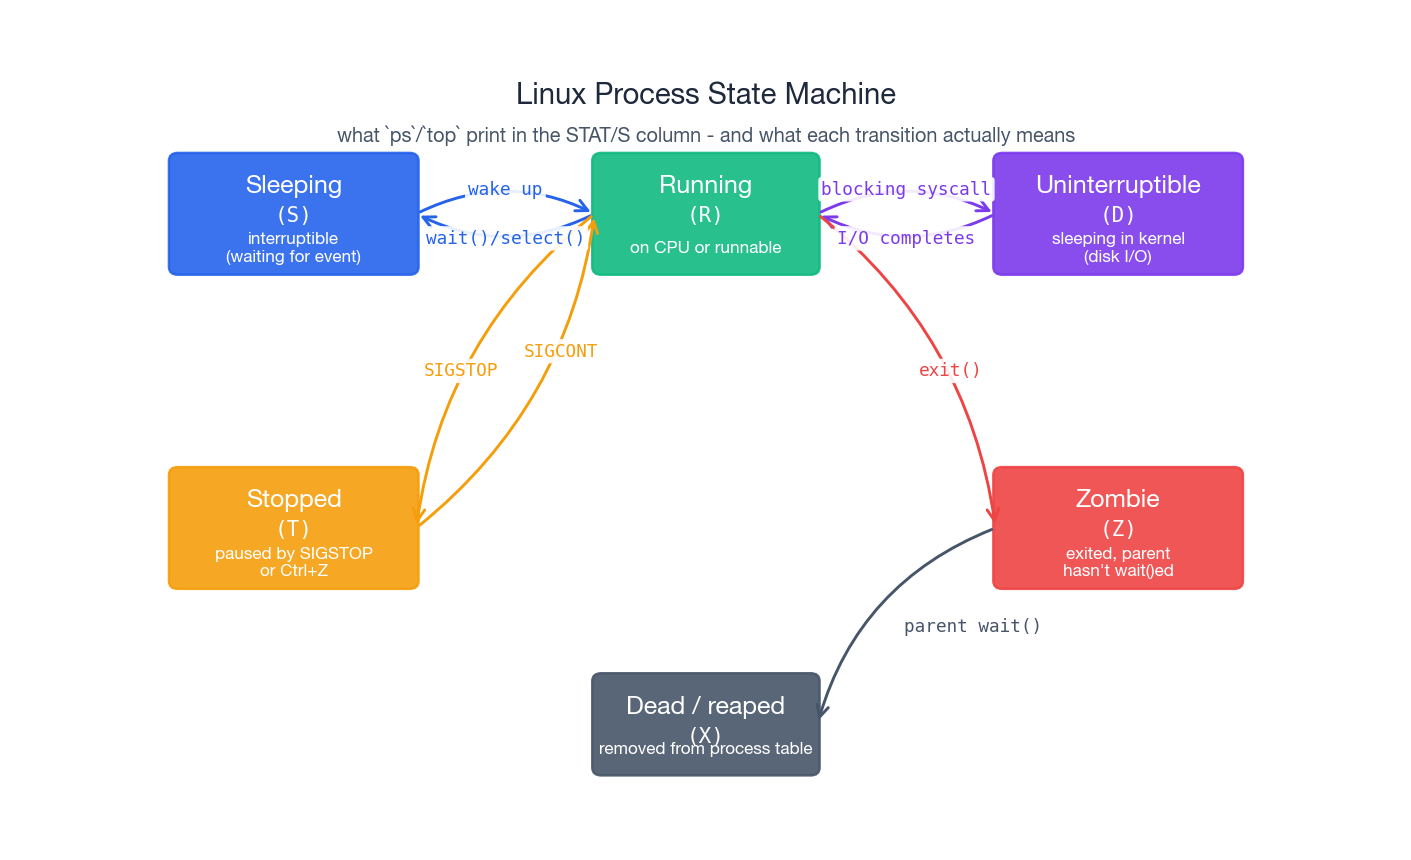
The process state machine#
ps and top show a one-letter STAT column for every process. Those letters correspond to the state the kernel currently has the task in:
| Code | State | Meaning |
|---|---|---|
R | Running | On a CPU right now, or on the runqueue waiting for one |
S | Interruptible sleep | Waiting for an event (read from socket, timer); woken by signals |
D | Uninterruptible sleep | Waiting on something the kernel won’t let go of, usually disk I/O — even kill -9 won’t move it |
T | Stopped | Paused by SIGSTOP/SIGTSTP (e.g. you hit Ctrl+Z) |
Z | Zombie | Already exited, but parent hasn’t called wait() to reap it |
X | Dead | Transient state during teardown, you almost never see it |
The state is not just trivia. A box with 200 processes in D is not “100 % CPU bound” — it is blocked on storage, and no amount of CPU tuning will help. A growing pile of Z processes points at a buggy parent that forgot to wait(). Stuck T processes mean somebody (or some script) sent SIGSTOP and never followed up with SIGCONT.
top’s top line — Tasks: 150 total, 2 running, 148 sleeping, 0 stopped, 0 zombie — is your first sanity check. Anything other than zero in stopped or zombie deserves a follow-up.
The four resource axes#
Before drowning in tools, fix the mental model. Almost every production problem maps to one of four axes:
- CPU — how much computation per second can be performed.
- Memory — how much working set the process can hold without going to disk.
- Disk I/O — how fast bytes can flow to and from persistent storage.
- Network — how fast bytes can flow in and out of the box.
A bottleneck on any of them slows everything that depends on it. The trick is figuring out which one — and that’s mostly what monitoring tools are for.
CPU#
What you usually want to know:
- How many cores does the box actually have?
nprocandlscpuanswer that. - How loaded is it?
uptimeshows three load averages: 1, 5 and 15 minutes.
Load average is not CPU utilisation. It counts processes that are either running or runnable plus uninterruptible (R + D). A 4-core box with load avg 4.0 and 95 % idle CPU is almost always a disk problem: tasks are piling up in D waiting for I/O, not for CPU. Read load against the number of cores: < cores is fine, ≈ cores is full, >> cores is overloaded.
| |
Memory#
free -h is the canonical view. The trap is reading it like Windows Task Manager:
| |
Newcomers see free: 1.0Gi and panic. Don’t. Linux deliberately uses spare RAM as buffer/cache to speed up I/O — that 11.5 GiB is reclaimable on demand. The number that matters is available: it accounts for the cache the kernel believes it could free if a process asked for memory.
The two flavours of cached memory:
- Buffer is a write-side staging area. When you write a file, bytes land in the page cache and are flushed to disk in batches; that is what makes small writes fast.
- Cache is the read-side: pages from disk that the kernel keeps around in case they are read again, which they very often are.
You are actually low on memory when all three of these become true at once:
availableis near zero,swap usedis climbing rather than just non-zero,- the kernel starts logging OOM kills (
dmesg | grep -i 'killed process').
Disk and network#
Disk capacity is df -h (per filesystem) and du -sh * (per directory). Real-time I/O lives in iostat -x 1 and iotop; the two metrics that matter are %util (how busy the device is) and await (how long requests sit in the queue). A device pegged at %util 100 with await in the tens of milliseconds is a real bottleneck.
Network is ss -tulnp for who is listening, ip -s link for interface counters and drops, and iftop (or nload) for live bandwidth. For “who is using port 80” the fastest answer is lsof -i :80 or ss -tulnp | grep :80.
The monitoring toolchain#
top — the first thing to run#
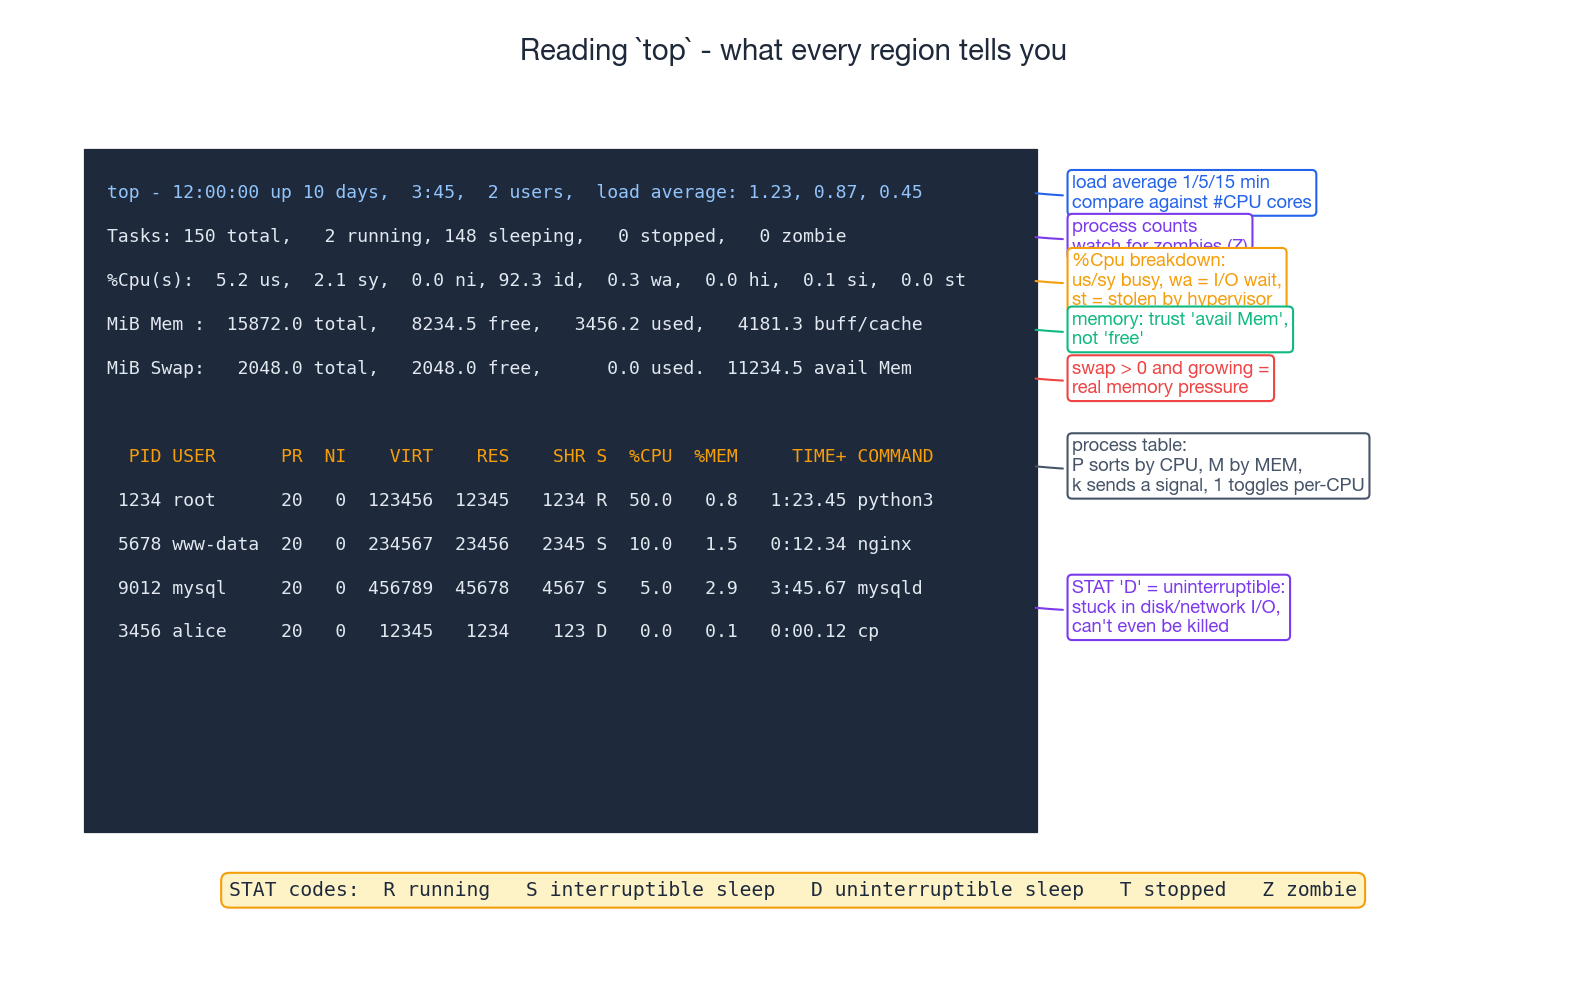
top is the cockpit view. Every region tells you something specific:
- Header: uptime, users, load average. Compare load against
nproc. - Tasks: total / running / sleeping / stopped / zombie. Last two should be zero.
%Cpu(s): broken down into user (us), system (sy), nice (ni), idle (id), I/O wait (wa), hardware/software interrupts (hi/si), and stolen (st). Highwameans slow disk. Highston a VM means the hypervisor is giving your CPU to other tenants — common in noisy-neighbour clouds.- Mem / Swap: trust
avail Mem, notfree. IfSwap usedis climbing, the box is under real memory pressure. - Process table: sortable by hotkey.
Psorts by%CPU,Mby%MEM,Tby time.1toggles per-CPU breakdown — invaluable when one core is pinned and the others sit idle.kprompts for a PID and signal.qquits.
htop — top with a UI#
htop is top with colour, mouse support, a tree view (F5) and a built-in signal sender (F9). On any box where you spend more than a minute in top, install it:
| |
ps — the static snapshot#
top refreshes; ps freezes a moment in time, which is often what you want for scripting and grep’ing.
| |
The columns worth knowing (ps aux):
VSZ— virtual memory size (what the process asked for; mostly meaningless on its own).RSS— resident set size, actual physical pages. This is the honest memory number.STAT— the state codes from the table above, sometimes with extra suffixes (<high-priority,Nlow-priority,ssession leader,+foreground process group).TIME— accumulated CPU time, not wall-clock.
pstree — who spawned whom#
| |
When a misbehaving process keeps coming back, look up the tree: something is respawning it.
lsof — every open file is something#
lsof lists open files, where “file” is meant in the Unix everything-is-a-file sense — regular files, sockets, pipes, devices, even kernel-side handles.
| |
The FD column is a tiny grammar of its own:
cwd— the process’s current working directorytxt— the program binary itselfmem— memory-mapped file (shared library)0r,1w,2w— stdin / stdout / stderrNu(u/r/w) — a regular open FD with mode
ss — sockets, the modern netstat#
| |
iostat and iotop — the disk axis#
| |
Watch %util, r/s, w/s, await. A device at %util 100 with single-digit await is busy but healthy; one at %util 100 with await in the hundreds is queued and miserable.
Controlling processes#
Signals#
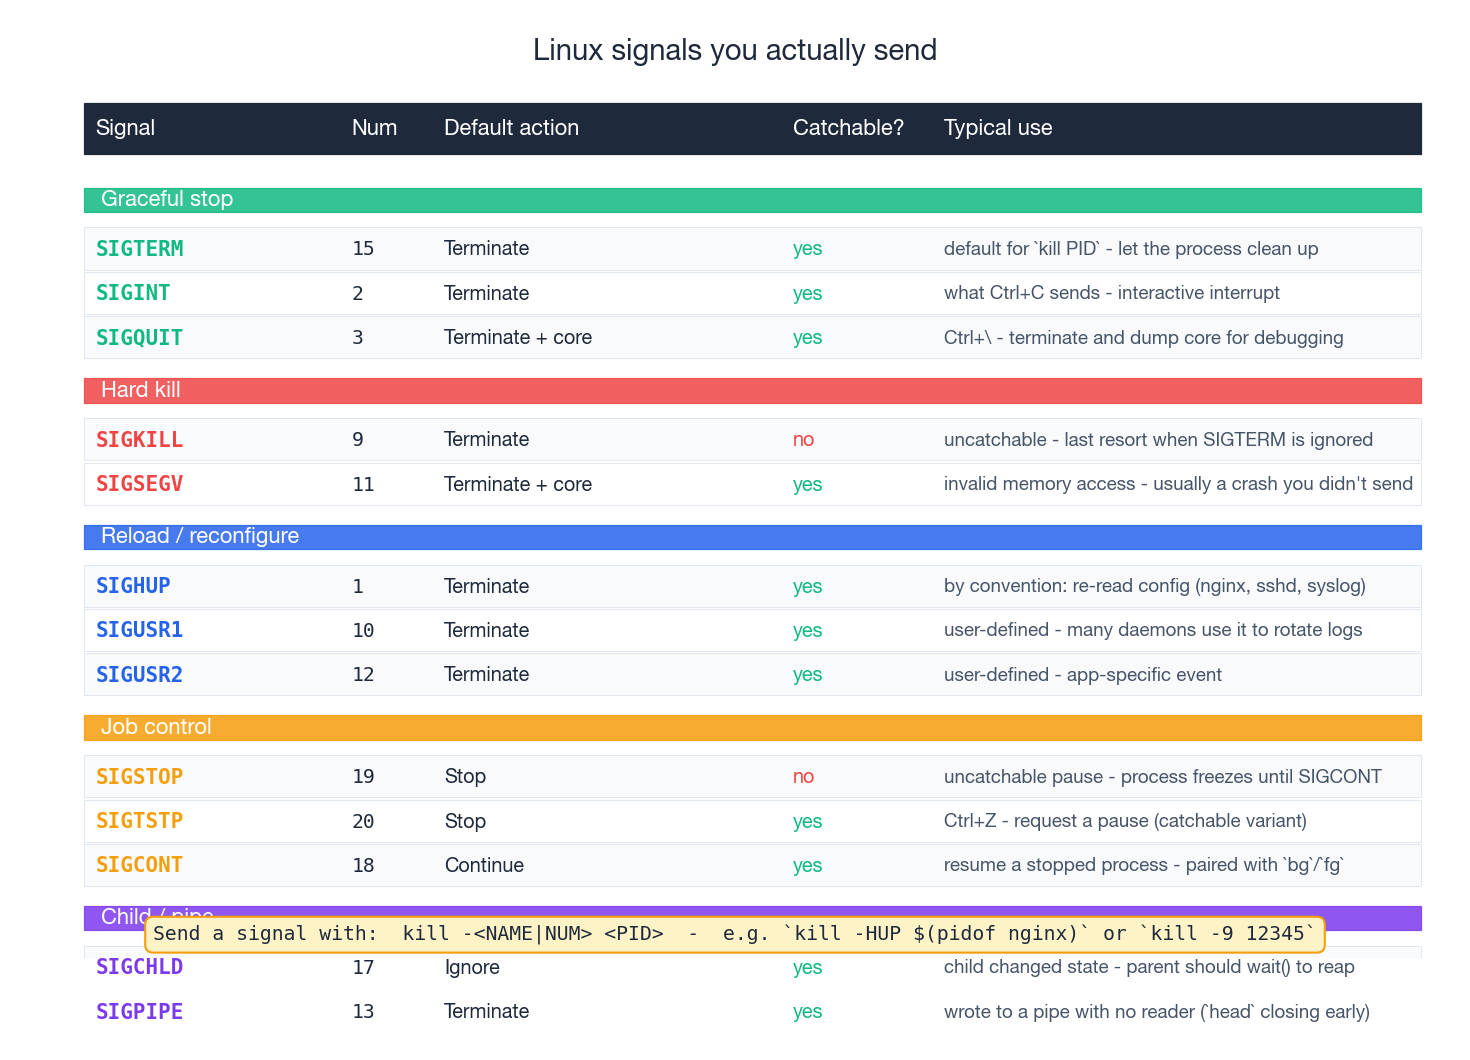
kill is misnamed. It does not kill anything; it sends a signal, and the signal’s default action happens to be “terminate” for most signals. The handful that actually matter day to day:
| Signal | Number | What it does |
|---|---|---|
SIGTERM | 15 | Polite request to terminate; process can clean up. Always try this first. |
SIGINT | 2 | What Ctrl+C sends; semantically “the user interrupted you” |
SIGHUP | 1 | Originally “the terminal hung up”; by convention, daemons treat it as reload config (nginx, sshd, syslog) |
SIGKILL | 9 | The nuclear option. Kernel kills the process, no cleanup, uncatchable. Last resort. |
SIGSTOP | 19 | Pause the process. Uncatchable. Resume with SIGCONT. |
SIGTSTP | 20 | Catchable variant of stop — what Ctrl+Z sends |
SIGCONT | 18 | Resume a stopped process |
SIGUSR1 / SIGUSR2 | 10 / 12 | Application-defined. Many daemons use SIGUSR1 to rotate logs. |
SIGCHLD | 17 | Sent to the parent when a child changes state. The parent should wait(). |
SIGPIPE | 13 | You wrote to a pipe with no reader (`yes |
The right escalation is always: try SIGTERM, give the process a few seconds, only then escalate to SIGKILL. kill -9 skips destructors, leaves locks held, leaves temp files behind, and corrupts databases that were mid-write. Reach for it last.
| |
Background jobs and detachment#
When you start something that needs to outlive your SSH session, three options in increasing order of robustness:
| |
tmux (or the older screen) is the right answer for anything interactive or long-running. For services, none of these are appropriate — write a systemd unit and let the init system supervise it (covered in the service-management post).
Foreground/background within one shell:
| |
Priorities: nice and renice#
The scheduler picks who runs next partly based on a process’s nice value, an integer from -20 (highest priority, scheduler favours it) to 19 (lowest, polite to others). Default is 0. Lowering nice below 0 requires root.
| |
nice is a soft hint — it influences scheduling weight but a low-priority process still gets CPU when nothing else wants it. For hard limits (e.g. “this batch job may use no more than 2 cores and 4 GiB”), use cgroups, not nice.
Orphans and zombies#
Two states that confuse newcomers, both rooted in the parent–child contract:
- Orphan: parent exits before the child. The kernel re-parents the child to PID 1, which inherits the duty to
wait()on it. Harmless in normal operation. - Zombie (
Z): child has already exited, but the parent has not calledwait()to collect its exit status. Thetask_structlingers in the process table holding a PID and exit code. Zombies use no CPU or memory, but they consume process-table slots — accumulate enough andfork()itself starts to fail.
The fix for zombies is to fix the parent. If the parent is a daemon under your control, it must wait() (or set up a SIGCHLD handler, or set SIGCHLD to SIG_IGN so the kernel auto-reaps). If the parent is third-party and broken, killing the parent re-parents the zombies to systemd, which reaps them immediately. Rebooting is the answer of last resort.
You can list current zombies cheaply:
| |
cgroups + namespaces — the foundation under containers#
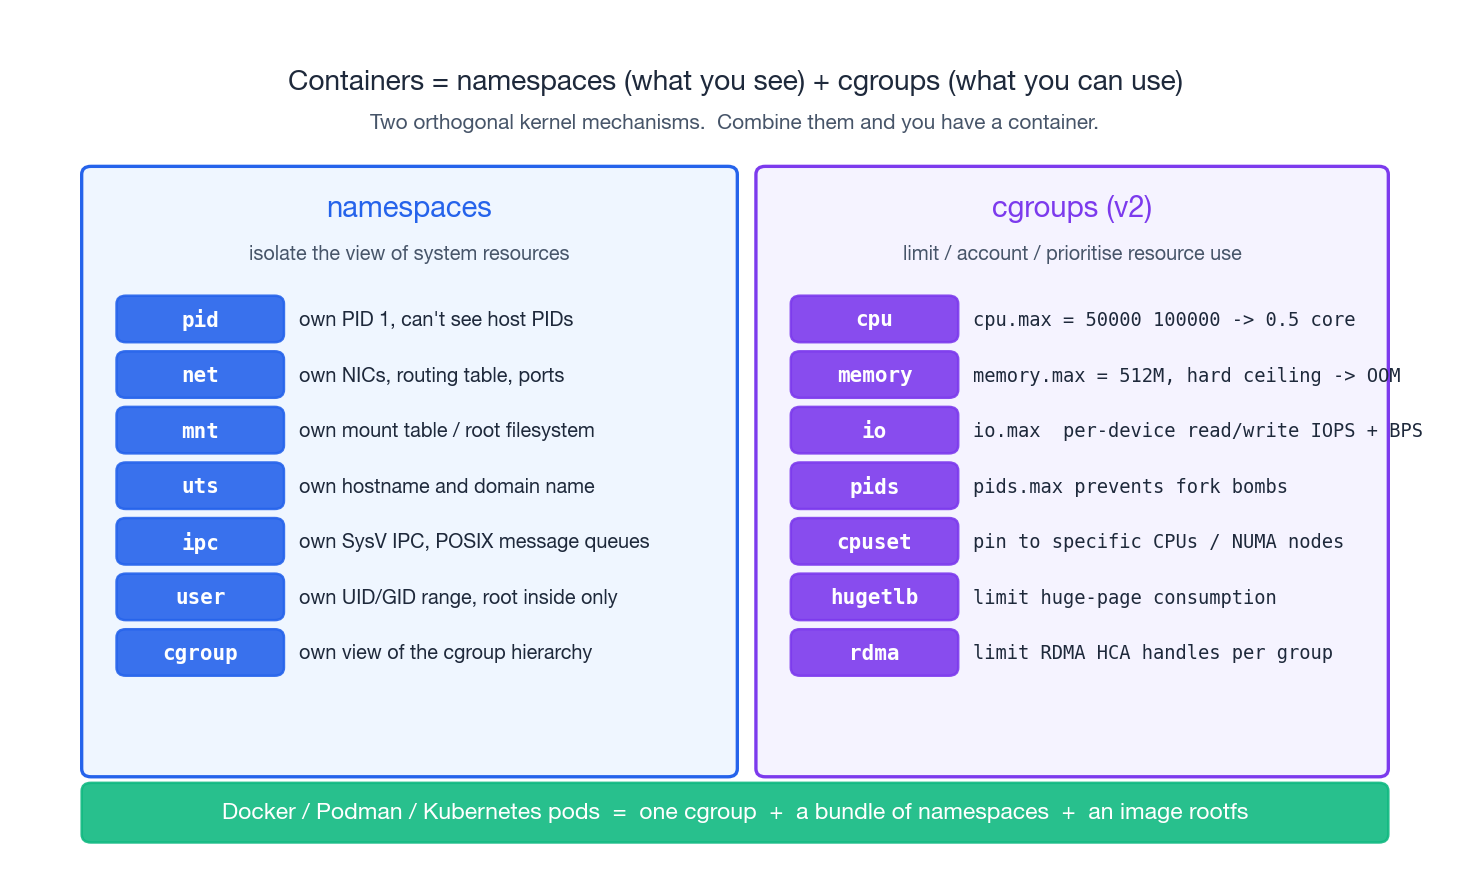
Once you understand processes, two kernel features explain how containers actually work — and they are useful even if you never touch Docker.
Namespaces isolate what a process can see. Each namespace virtualises a different system resource:
pid— own PID space; PID 1 inside is not PID 1 outside.net— own network interfaces, routing table, sockets.mnt— own mount table; the root filesystem can be entirely different.uts— own hostname and domain name.ipc— own SysV/POSIX IPC objects.user— own UID/GID range; root inside maps to an unprivileged UID outside.cgroup— own view of the cgroup hierarchy.
cgroups (control groups, v2) limit what a process can use. A cgroup is a directory under /sys/fs/cgroup/ containing the PIDs that belong to it and a set of files that configure resource caps:
| |
The controllers worth knowing:
cpu.max— bandwidth cap (quota / period).cpu.weight— relative share when contended.memory.max— hard ceiling; exceeding it triggers the OOM killer inside the cgroup rather than across the host.io.max— per-device IOPS and BPS caps.pids.max— fork-bomb protection; cap the number of processes in the group.cpuset.cpus— pin to specific CPUs / NUMA nodes.
A container engine like Docker, Podman or containerd is, fundamentally, a small program that:
- Creates a fresh set of namespaces (
unshare(2)orclone(2)with the right flags). - Pivots into a new root filesystem extracted from an image.
- Puts the resulting process tree into a cgroup with the caps you asked for (
docker run --cpus 0.5 --memory 512m).
Once you have seen this, container debugging becomes much less mysterious. nsenter -t <PID> -a enters a running container’s namespaces; cat /proc/<PID>/cgroup tells you which group it lives in; systemd-cgtop is top for cgroups.
Walkthrough: “the box feels slow, what now?”#
A repeatable order of operations for triaging “slow”:
| |
Resist the temptation to skip step 2. Most “the server is slow” tickets are misdiagnosed because somebody jumped straight to top, saw 100 % CPU on one process, and kill -9’d it — when the real problem was a saturated disk and the process was simply waiting in D.
Real-world: recovering an accidentally deleted log file#
Classic incident: someone runs rm -rf /var/log/nginx/access.log while nginx is happily writing to it. After the rm:
ls /var/log/nginx/no longer shows the file (the directory entry is gone).df -hreports the same usage as before (the inode and data blocks are still allocated).- nginx keeps writing to the same FD as if nothing happened — because it is.
This is straight out of Unix semantics: a file is unlinked from its directory, but as long as any process still holds an open FD to it, the inode lives on. The kernel exposes that FD under /proc/<pid>/fd/<fd>, which means you can copy the file back out:
| |
The same trick works for any deleted-but-still-open file. The moment the last FD is closed, though, the kernel really frees the inode — so do this now, before the daemon restarts.
Summary#
- A process is a running program with its own address space; threads share that space; only
task_structs exist as far as the scheduler is concerned. - New processes are created by
fork()+exec(), never from scratch. PID 1 (systemd/init) is the root of every process tree. - The state machine (
R/S/D/T/Z) is whatps/topprint, and each state implies a different troubleshooting path. - Resource bottlenecks live on four axes — CPU, memory, disk I/O, network — and most monitoring tools are just different views of the same axes.
- Linux memory looks scarier than it is:
available, notfree, is the number to trust. killsends signals;SIGTERMfirst,SIGKILLlast. Daemons reload onSIGHUP.nice/reniceare soft scheduling hints; cgroups are hard caps and they are the real foundation of containers, alongside namespaces.
Further reading#
- Brendan Gregg, Linux Performance — http://www.brendangregg.com/linuxperf.html
man proc(5)— exhaustive reference for/procman 7 signal— every signal, default action, and catchability ruleman 7 cgroups— cgroup v2 design and controller listman 7 namespaces— what each namespace virtualises
Up next in this series#
- Linux Disk Management — partitions, filesystems, LVM and the mount stack
- Linux User Management — users, groups, sudo, PAM, and the principle of least privilege
By this point you should be able to walk into a slow box, name the saturated axis within a minute, and pick a tool with intent rather than by reflex. That is the difference between running top and operating a system.
Linux 9 parts
- 01 Linux (1): Basics — Core Concepts and Essential Commands
- 02 Linux (2): File Permissions — rwx, chmod, chown, and Beyond
- 03 Linux (3): Disk Management — Partitions, Filesystems, LVM, and the Mount Stack
- 04 Linux (4): Package Management — apt, dnf, pacman, and Building from Source
- 05 Linux (5): User Management — Users, Groups, sudo, and Security
- 06 Linux (6): Service Management — systemd, systemctl, and journald
- 07 Linux (7): Process and Resource Management: From `top` to cgroups you are here
- 08 Linux (8): Pipelines and File Operations — Composing Tools into Data Flows
- 09 Linux (9): Vim Essentials