我职业生涯中最严重的一次生产事故,排查整整花了三个小时。当时一个 Node.js 服务间歇性返回 502 错误,大约 5% 的请求受影响,而我手头几乎没有任何工具:没有集中式日志(每台 ECS 实例都有自己的 /var/log/,我只能一台台 SSH 登录查看);没有监控大盘(只能在终端里反复执行 top 和 df -h);也没有链路追踪(只能靠手动添加 console.log 时间戳,试图定位哪个下游调用卡住了)。三小时后,问题终于浮出水面:一个被遗忘的定时任务占着数据库连接不释放,导致 RDS 连接池在高负载下耗尽。修复只需两行代码,但诊断过程却耗费了整整三小时——只因系统毫无可观测性可言。
这次教训简单却代价高昂:可观测性绝不是应用稳定后的“锦上添花”,而是上线前就必须就绪的基础设施。理想情况下,甚至应在编写第一行应用代码前就搭建好,因为可观测性栈会直接影响你的日志结构、请求 ID 透传方式以及依赖库的埋点策略。如果等到最后才补,你将不得不对整个系统进行返工;而如果一开始就集成,一切都会水到渠成。
本文将完整介绍阿里云上的可观测性体系:SLS 负责日志,CloudMonitor 负责指标,ARMS 负责链路追踪。读完后,你将为本系列一直在构建的生产 Web 应用部署一套可用的监控方案。其中 ECS 实例来自 Part 2
,网络架构来自 Part 3
。若希望使用 Terraform 自动化部署这些监控资源,请参考 Terraform Part 7: Observability and Cost Control
。
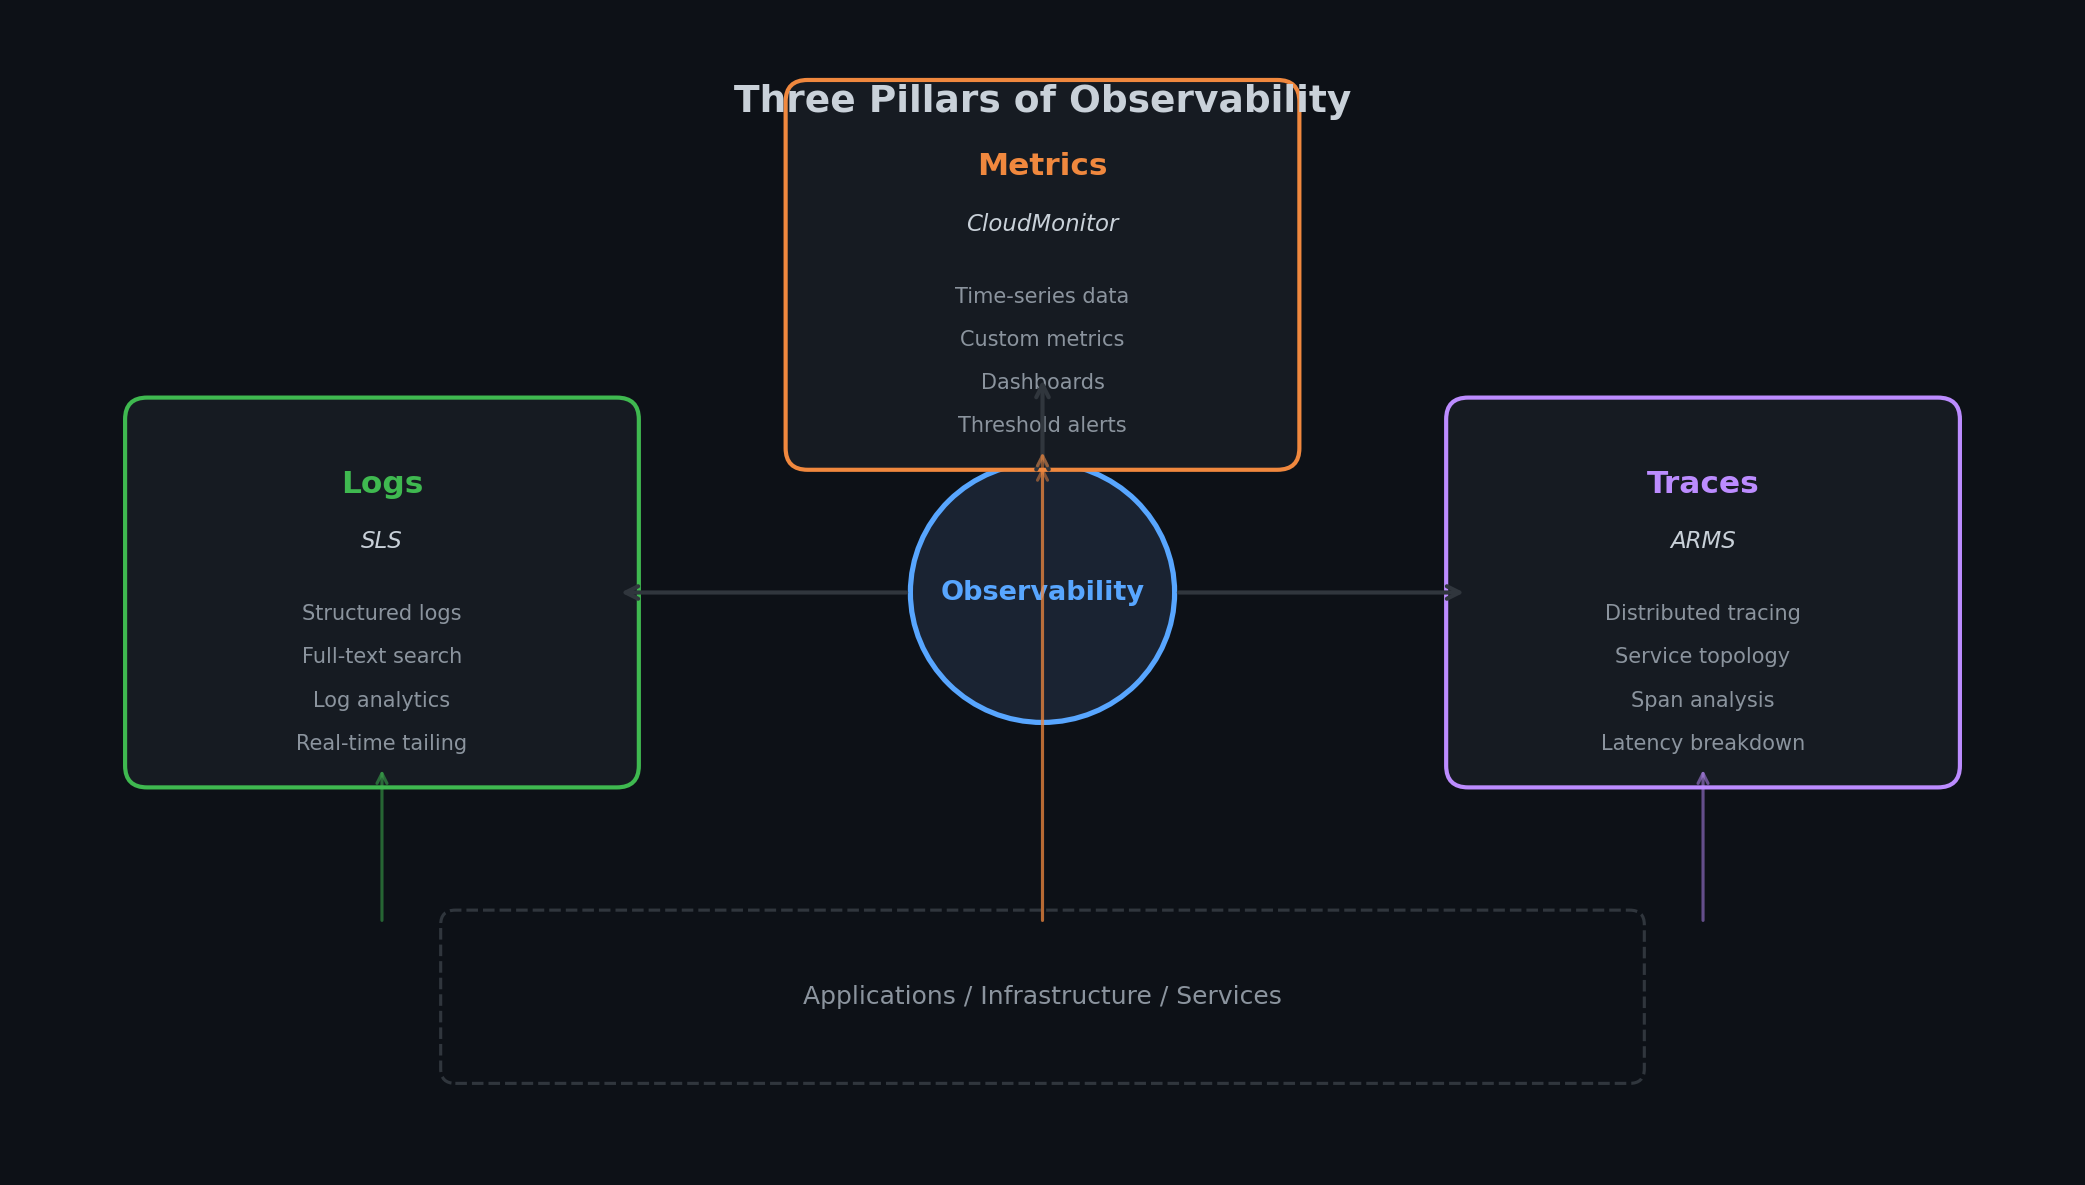
可观测性的三大支柱# 业界已普遍认同,以下三种信号组合起来,才能完整还原系统运行状态:
日志(Logs) 告诉你“发生了什么”。例如:“14:32:07,用户 abc123 请求了 /api/orders,因数据库连接超时 30 秒而返回 500。” 日志是带时间戳的离散事件,结构化且可追溯,是故障发生后的关键证据。
指标(Metrics) 告诉你“当前正在发生什么”。例如:“/api/orders 的 P99 延迟当前为 2.3 秒,应用层 CPU 利用率达 78%,RDS 连接池已耗尽 90%。” 指标是数值型时间序列,如同系统的生命体征,让你能在用户投诉前就发现异常。
链路追踪(Traces) 告诉你“为什么会发生”。例如:“该请求在 API 网关耗时 15ms,在订单服务耗时 200ms,等待数据库查询耗时 1800ms,序列化响应耗时 50ms。” 链路追踪跟随单个请求穿越多个服务,如同分布式系统的 X 光片,精准定位性能瓶颈所在。
三者缺一不可:指标告诉你“出事了”(如错误率突增),日志告诉你“哪里出错了”(如数据库超时),而链路追踪则揭示“为何出错”(如某条查询因索引被删而执行全表扫描)。
在阿里云上,这种映射关系非常清晰:
支柱 阿里云服务 AWS 对应服务 功能 日志 SLS(Simple Log Service) CloudWatch Logs + OpenSearch 日志收集、索引、查询与分析 指标 CloudMonitor CloudWatch Metrics 基础设施与自定义指标、告警 链路追踪 ARMS(Application Real-Time Monitoring) X-Ray + CloudWatch APM APM、分布式追踪、服务拓扑
这三项服务彼此打通:CloudMonitor 可基于 SLS 查询结果触发告警;ARMS 的追踪记录能直接关联到 SLS 中的日志条目;SLS 仪表盘也能嵌入 CloudMonitor 的指标数据。虽然集成体验不如 Datadog 那样无缝,但无需第三方工具即可覆盖 90% 的日常需求。
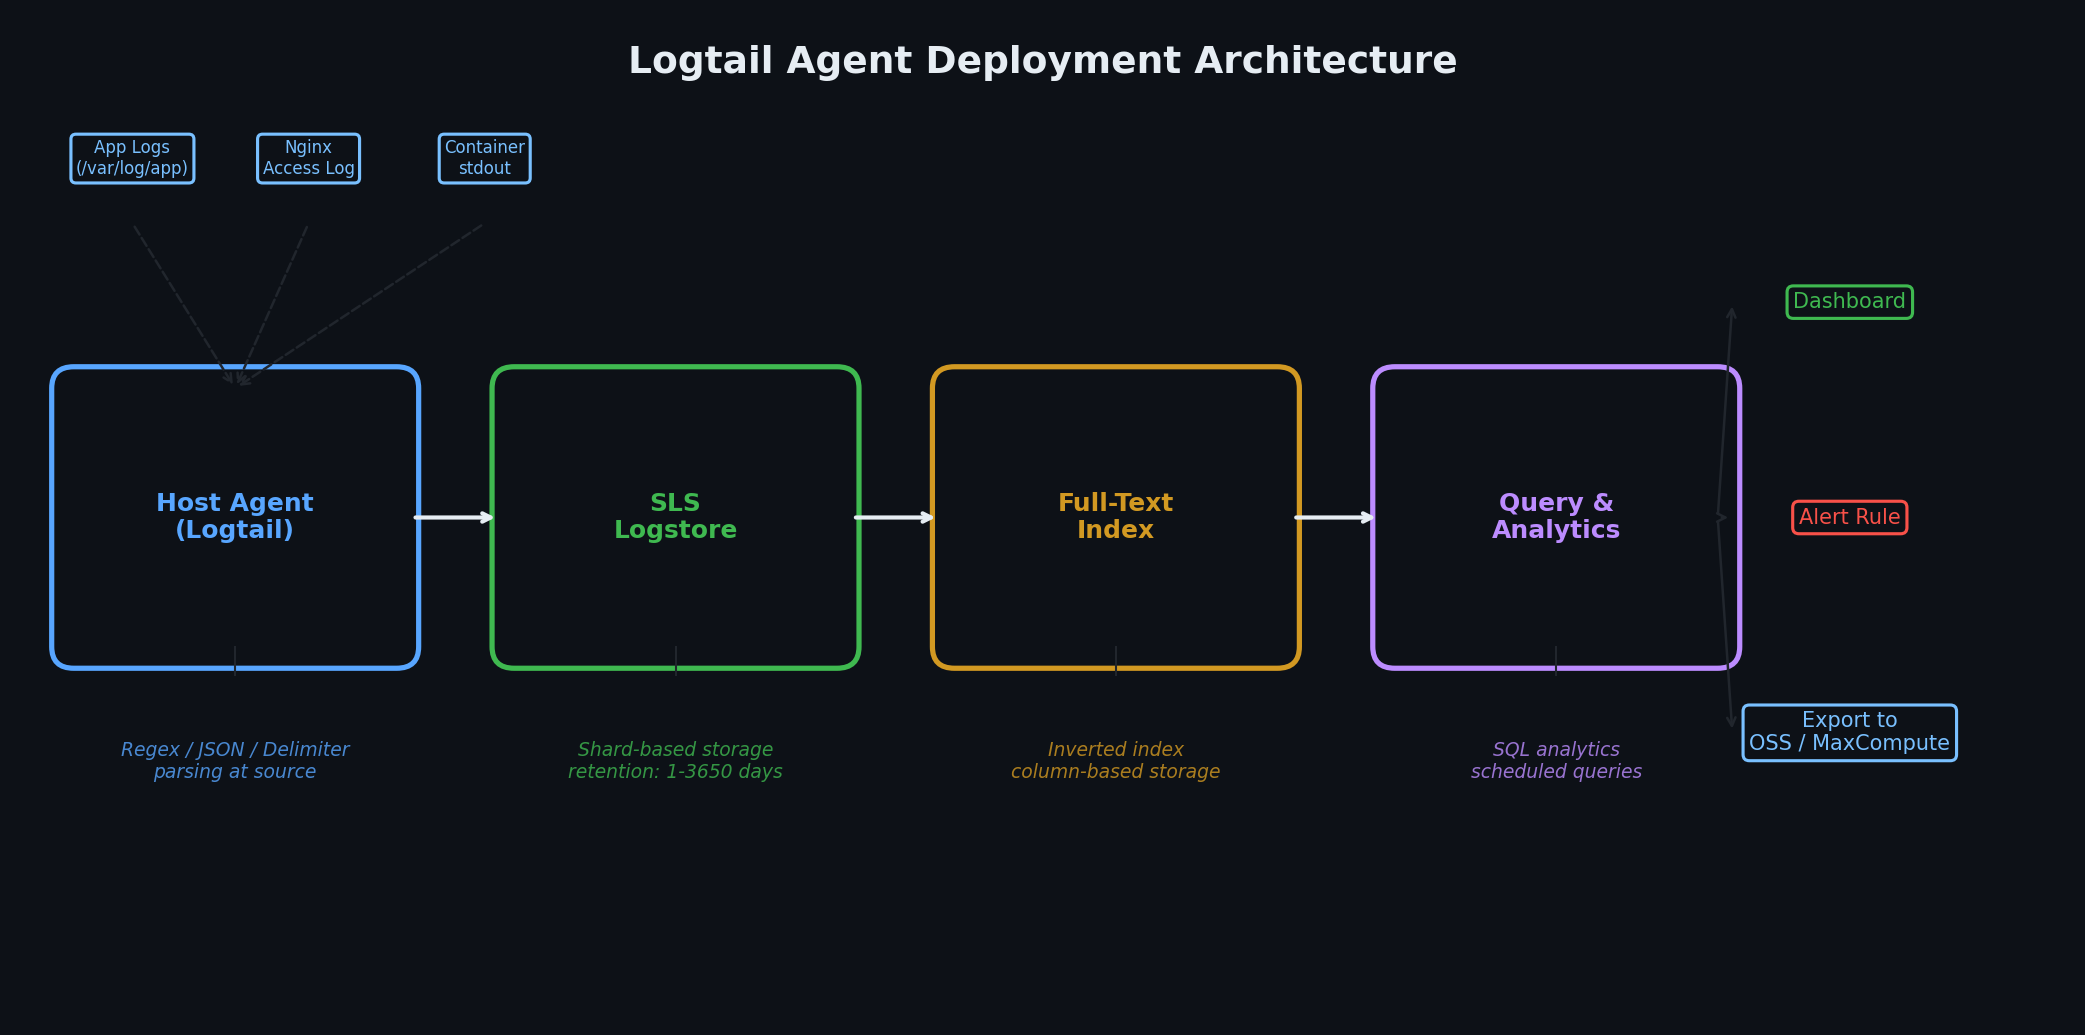
SLS:Simple Log Service# SLS 是阿里云可观测体系的基石。尽管名字里有 “Simple”,它实则是一个功能完备的日志分析平台,集采集、存储、索引、查询、可视化与告警于一体。你可以把它看作 AWS CloudWatch Logs 与 Elasticsearch 的结合体,还额外内置了 SQL 查询引擎。
核心概念# SLS 采用两级结构组织数据:
Project(项目) —— 顶层容器,通常每个环境或应用对应一个。Project 是区域(Region)级别的,其内部的所有 Logstore、仪表盘和告警共享同一计费账户与访问控制策略。
Logstore(日志库) —— Project 内的日志数据表。每个 Logstore 拥有独立的 schema、保留周期和索引配置。通常按日志来源划分:一个用于 Nginx 访问日志,一个用于应用日志,一个用于系统日志。
1
2
3
4
5
6
7
8
SLS Project: prod-webapp
├── Logstore: nginx-access-log     (30-day retention)
├── Logstore: app-log              (30-day retention)
├── Logstore: system-log           (7-day retention)
├── Logstore: slow-query-log       (90-day retention)
├── Dashboard: ops-overview
├── Dashboard: error-analysis
└── Alert: high-error-rate
可通过 CLI 创建 Project 和 Logstore:
 1
 2
 3
 4
 5
 6
 7
 8
 9
10
11
12
13
14
15
16
17
18
19
20
21
22
23
24
25
26
27
28
29
30
31
# Create the SLS project
aliyun sls CreateProject \
'{
"projectName": "prod-webapp",
"description": "Production web application logs"
}' \
# Create the nginx access log logstore
aliyun sls CreateLogStore \
\
'{
"logstoreName": "nginx-access-log",
"ttl": 30,
"shardCount": 2,
"autoSplit": true,
"maxSplitShard": 8
}' \
# Create the application log logstore
aliyun sls CreateLogStore \
\
'{
"logstoreName": "app-log",
"ttl": 30,
"shardCount": 2,
"autoSplit": true,
"maxSplitShard": 8
}' \
shardCount 决定写入吞吐能力。每个 shard 支持 5 MB/s 写入和 10 MB/s 读取。两个 shard 即提供 10 MB/s 的写入容量。启用 autoSplit 后,当写入压力超过阈值,SLS 会自动扩容 shard,最多增至 maxSplitShard 所设上限。
SLS 与 AWS 的差异# 如果你熟悉 AWS,需注意 SLS 并非 CloudWatch Logs 的简单等价物,其能力边界更广:
能力 SLS AWS 日志采集代理 Logtail(SLS 原生) CloudWatch Agent 全文搜索 内置,亚秒级延迟 CloudWatch Logs Insights(较慢) SQL 分析 完整 SQL 语法支持 CloudWatch Logs Insights(SQL 功能有限) 仪表盘 内置于 SLS CloudWatch Dashboards(独立服务) 长期存储 内置分层存储 需导出至 S3 + Athena 读时模式(Schema-on-read) 支持,配合索引 部分支持(Insights) 实时流处理 内置消费者组 Kinesis Data Streams(独立服务)
最大区别在于:SLS 将日志存储、搜索与分析整合于单一服务;而在 AWS 上,你通常需要组合 CloudWatch Logs(采集)、S3(归档)、OpenSearch(搜索)和 Athena(SQL 分析)。SLS 在一个平台内完成全部工作,代价是存在厂商锁定——其查询语法并非跨云通用标准。
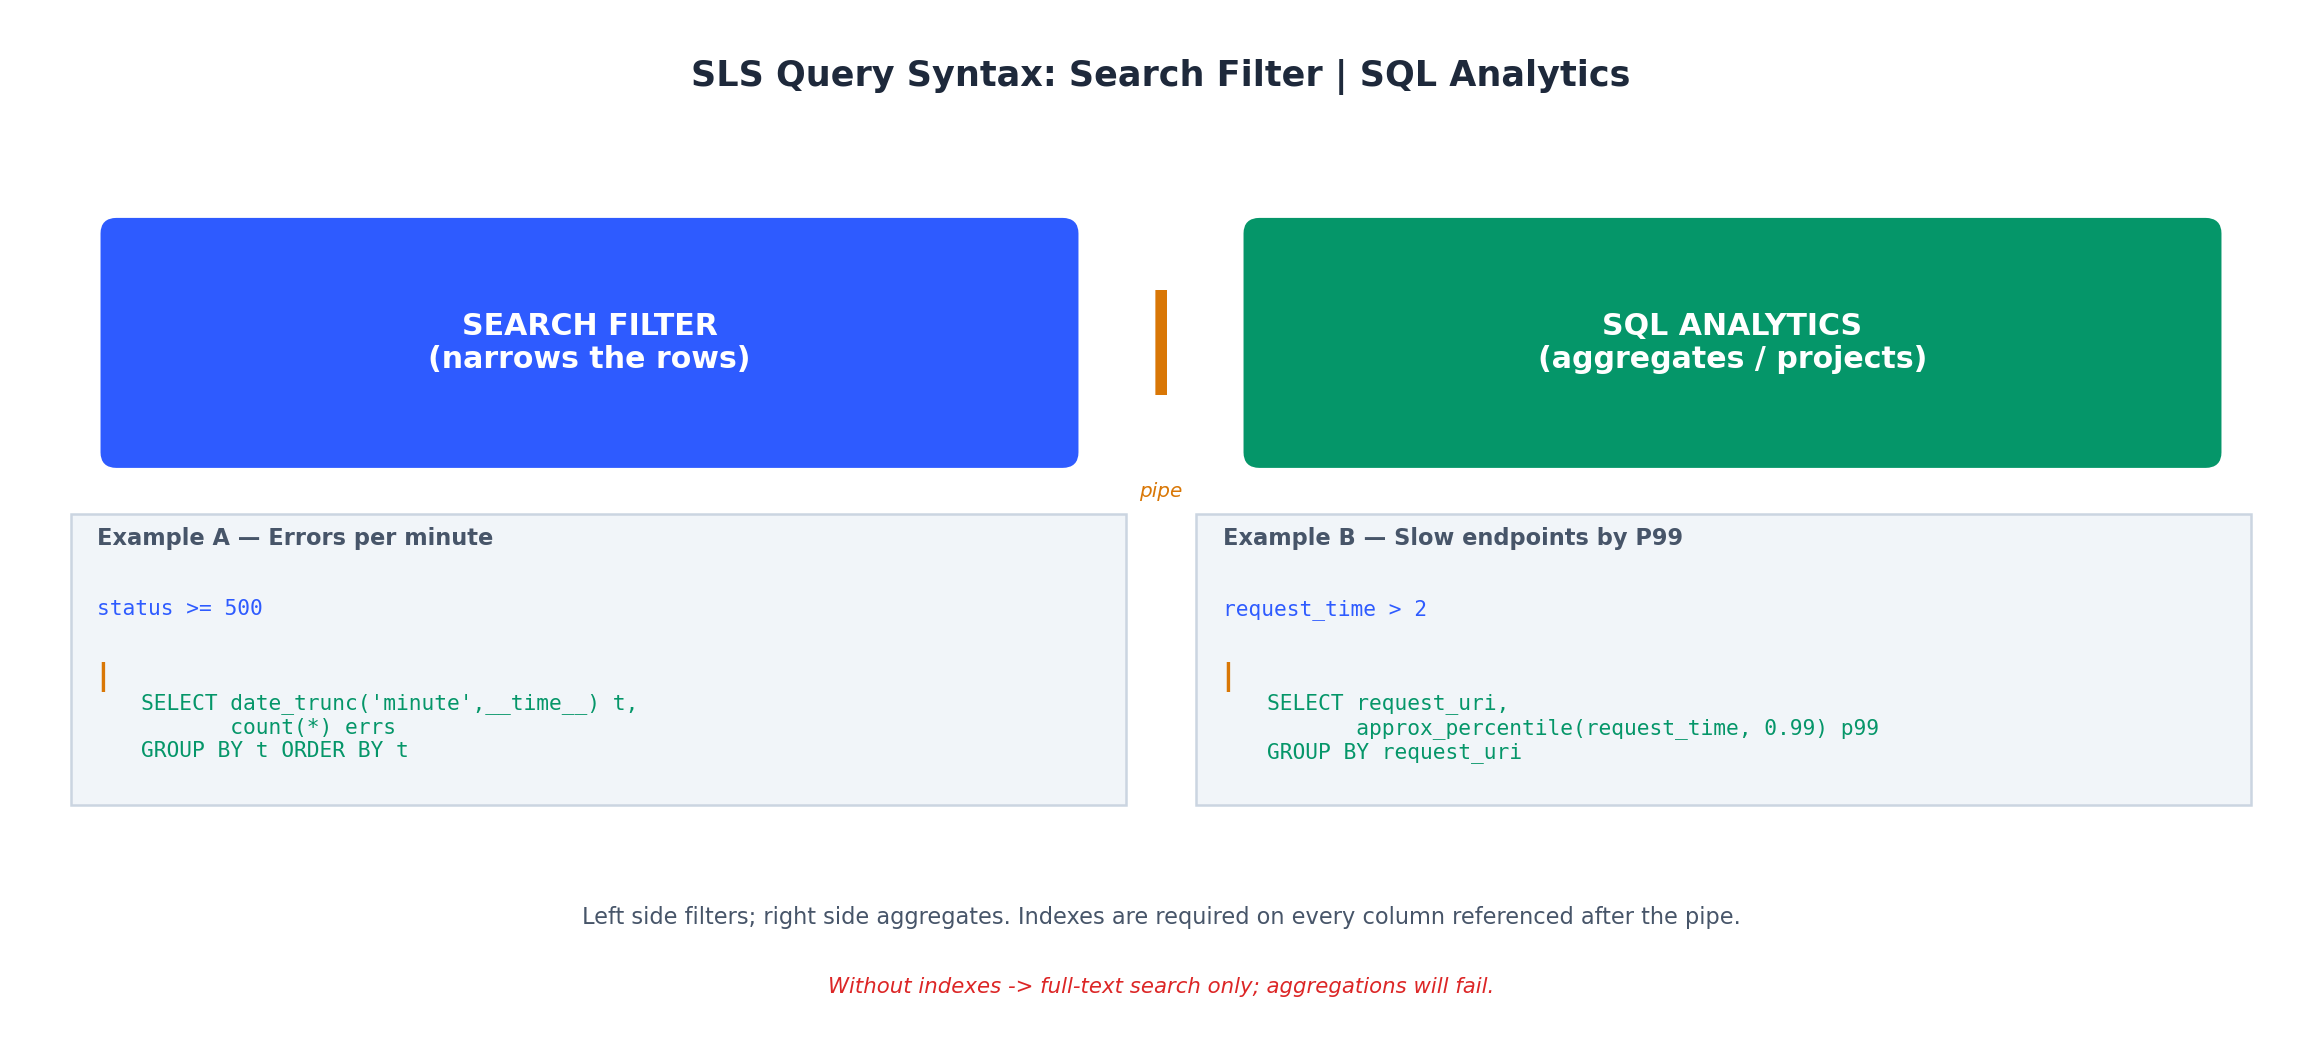
日志查询语法# SLS 支持三种查询模式,掌握它们能大幅提升效率:
全文搜索(Full-text search) —— 直接输入关键词,SLS 会在所有已索引字段中匹配。
此查询返回所有包含 “ERROR” 的日志行。
键值搜索(Key-value search) —— 使用字段名与操作符进行精确过滤。
1
status >= 500 and request_method: POST
该查询返回 HTTP 状态码 ≥500 且请求方法为 POST 的日志。其中冒号 : 表示“包含”,>= 用于数值比较。
SQL 分析(SQL analytics) —— 在搜索表达式后加管道符 |,即可使用标准 SQL。
1
2
3
4
5
6
status >= 500 | SELECT
  date_format(__time__, '%H:%i') as time_bucket,
  count(*) as error_count,
  approx_distinct(client_ip) as affected_users
GROUP BY time_bucket
ORDER BY time_bucket
此查询先筛选出所有 5xx 错误,再按分钟聚合,展示每分钟的错误数量及受影响的唯一用户数。__time__ 是内置时间戳字段,approx_distinct 基于 HyperLogLog 算法,对高基数字段高效且节省内存。
以下是我日常使用的实用查询:
 1
 2
 3
 4
 5
 6
 7
 8
 9
10
11
12
13
14
15
16
17
18
19
20
21
22
23
24
25
26
27
28
29
30
31
32
33
34
35
36
# Error rate over the last hour (as percentage)
* | SELECT
round( count_if( status >= 500) * 100.0 / count( *) , 2) as error_rate_pct,
count( *) as total_requests
WHERE __time__ > unix_timestamp() - 3600
# P50, P90, P99 latency by endpoint
* | SELECT
request_uri,
approx_percentile( request_time, 0.50) as p50_ms,
approx_percentile( request_time, 0.90) as p90_ms,
approx_percentile( request_time, 0.99) as p99_ms,
count( *) as request_count
GROUP BY request_uri
ORDER BY request_count DESC
LIMIT 20
# Top 10 client IPs by request volume (bot detection)
* | SELECT
client_ip,
count( *) as requests,
count_if( status >= 400) as errors,
round( count_if( status >= 400) * 100.0 / count( *) , 1) as error_pct
GROUP BY client_ip
ORDER BY requests DESC
LIMIT 10
# Slow requests (>2 seconds)
request_time > 2 | SELECT
request_uri,
request_time,
status,
client_ip,
__time__
ORDER BY request_time DESC
LIMIT 50
启用索引# SLS 默认不对字段建立索引。若要使用键值查询或 SQL 分析,必须预先配置索引。否则仅能依赖全文搜索(且前提是启用了全文索引)。
 1
 2
 3
 4
 5
 6
 7
 8
 9
10
11
12
13
14
15
16
17
18
19
aliyun sls CreateIndex \
\
\
'{
"line": {
"token": [",", " ", "\"", "\\t", ";", "=", "(", ")", "[", "]", "{", "}", "?", "@", "&", "/", ":", "' "'" '"]
},
"keys": {
"client_ip": {"type": "text", "doc_value": true},
"request_method": {"type": "text", "doc_value": true},
"request_uri": {"type": "text", "doc_value": true, "token": ["/", "?", "&", "="]},
"status": {"type": "long", "doc_value": true},
"body_bytes_sent": {"type": "long", "doc_value": true},
"request_time": {"type": "double", "doc_value": true},
"upstream_response_time": {"type": "double", "doc_value": true},
"http_user_agent": {"type": "text", "doc_value": true}
}
}' \
line 部分启用全文索引,并指定分词符;keys 部分定义字段级索引。设置 doc_value: true 可启用该字段的 SQL 分析能力。每个索引字段都会增加存储成本,因此只索引你实际会查询的字段。
成本提示 :索引会使存储成本大致翻倍。对于高吞吐日志,若仅需全文检索,可跳过字段索引,仅依赖 line 索引;而对于需频繁进行 SQL 分析的访问日志(如构建仪表盘),字段索引带来的开销是值得的。
配置 Logtail# Logtail 是 SLS 官方日志采集代理,运行于 ECS 实例,负责监控日志文件、按配置解析并投递至 SLS。它轻量(通常占用 50–100 MB 内存,CPU 使用率低于 1%)、可靠(通过本地缓冲应对网络中断),并与 SLS 深度集成。
若 ECS 实例与 SLS 位于同一地域,安装只需一条命令:
1
2
3
4
5
6
7
# Download and install Logtail (cn-hangzhou region)
wget http://logtail-release-cn-hangzhou.oss-cn-hangzhou-internal.aliyuncs.com/linux64/logtail.sh -O logtail.sh
chmod 755 logtail.sh
sudo ./logtail.sh install cn-hangzhou

# Verify installation
sudo /etc/init.d/ilogtaild status
安装脚本会自动识别实例是否处于 VPC 内网,并配置相应 endpoint。VPC 内网通信免费——同地域内日志投递不产生流量费用。
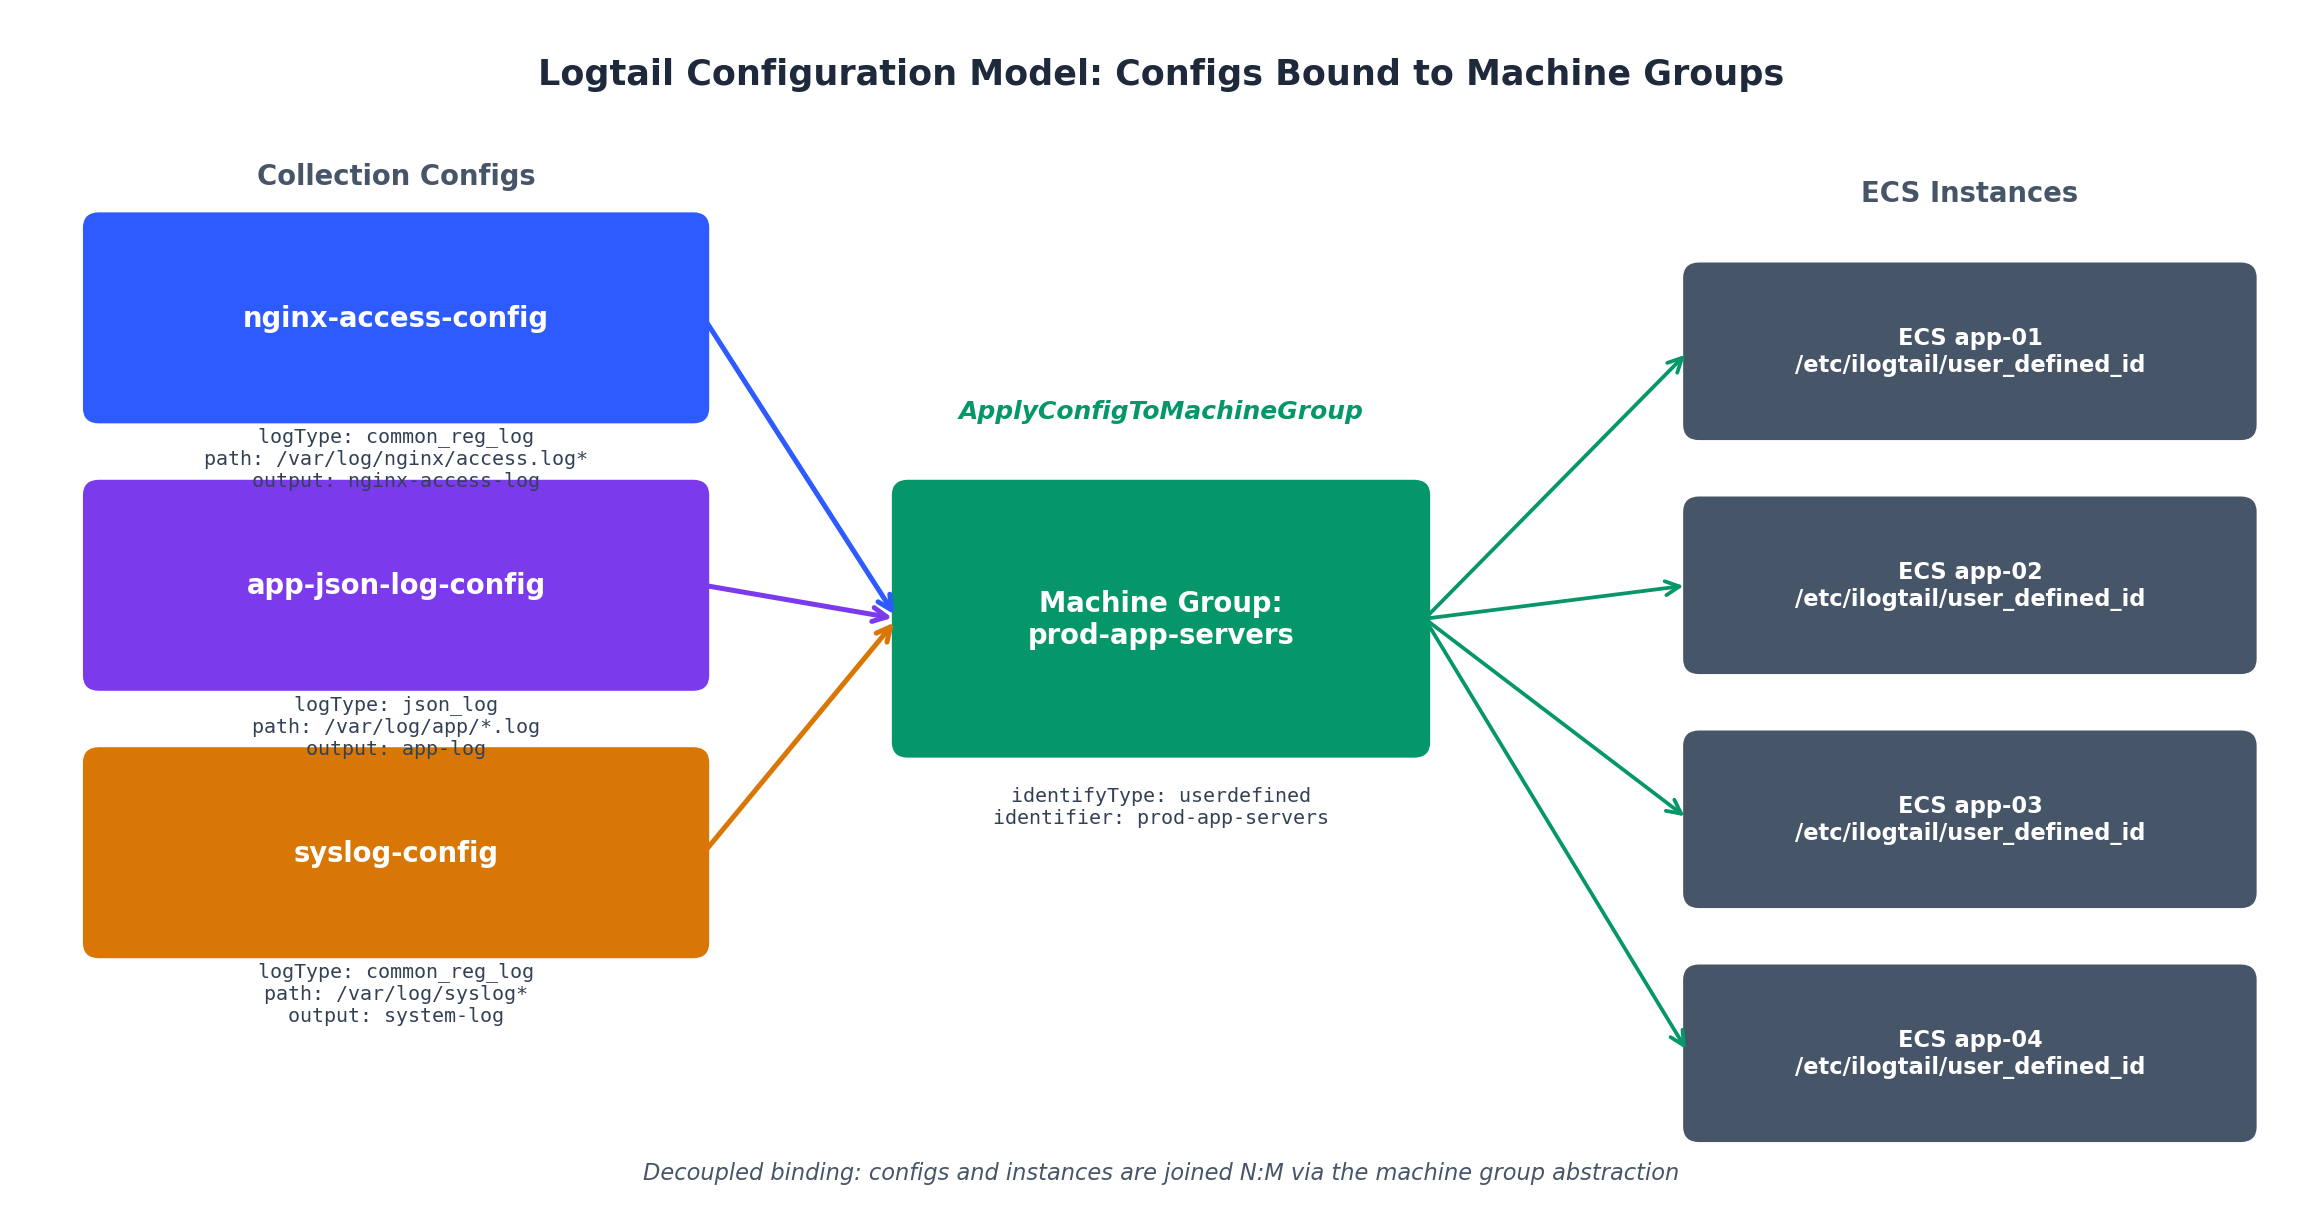
安装完成后,需在 SLS 中创建机器组(machine group),用于标识哪些实例应接收哪些采集配置:
 1
 2
 3
 4
 5
 6
 7
 8
 9
10
11
12
13
14
15
16
17
18
aliyun sls CreateMachineGroup \
\
'{
"groupName": "prod-app-servers",
"machineIdentifyType": "ip",
"groupType": "",
"groupAttribute": {
"externalName": "",
"groupTopic": ""
},
"machineList": [
"10.0.10.5",
"10.0.10.6",
"10.0.11.5",
"10.0.11.6"
]
}' \
对于 IP 动态变化的弹性伸缩组,建议使用用户自定义标识而非 IP。在每台实例上创建文件 /etc/ilogtail/user_defined_id,写入如 prod-app-servers 的标识,并将 machineIdentifyType 设为 userdefined。
采集 Nginx 访问日志# 最常见的场景是解析 Nginx 访问日志,建议使用结构化格式。首先配置 Nginx 输出结构化日志:
1
2
3
4
5
6
7
8
# /etc/nginx/nginx.conf
log_format structured ' $remote_addr - $remote_user [ $time_local] '
'" $request_method $request_uri $server_protocol" '
' $status $body_bytes_sent '
'" $http_referer" " $http_user_agent" '
' $request_time $upstream_response_time' ;
access_log /var/log/nginx/access.log structured ;
然后创建 Logtail 采集配置以解析该格式:
 1
 2
 3
 4
 5
 6
 7
 8
 9
10
11
12
13
14
15
16
17
18
19
20
21
22
23
24
{
"configName" : "nginx-access-config" ,
"inputType" : "file" ,
"inputDetail" : {
"logType" : "common_reg_log" ,
"logPath" : "/var/log/nginx" ,
"filePattern" : "access.log*" ,
"topicFormat" : "none" ,
"timeFormat" : "%d/%b/%Y:%H:%M:%S" ,
"regex" : "([\\d.]+) - (\\S+) \\[(\\S+ \\S+)\\] \"(\\w+) (\\S+) (\\S+)\" (\\d+) (\\d+) \"([^\"]*)\" \"([^\"]*)\" ([\\d.]+) ([\\d.-]+)" ,
"key" : [
"client_ip" , "remote_user" , "time_local" ,
"request_method" , "request_uri" , "protocol" ,
"status" , "body_bytes_sent" ,
"http_referer" , "http_user_agent" ,
"request_time" , "upstream_response_time"
]
},
"outputType" : "LogService" ,
"outputDetail" : {
"projectName" : "prod-webapp" ,
"logstoreName" : "nginx-access-log"
}
}
通过 CLI 应用配置:
 1
 2
 3
 4
 5
 6
 7
 8
 9
10
11
aliyun sls CreateConfig \
\
\
# Bind the config to the machine group
aliyun sls ApplyConfigToMachineGroup \
\
\
\
一分钟内日志即开始流入。可通过 SLS 控制台或 CLI 验证:
1
2
3
4
5
6
7
8
aliyun sls GetLogs \
\
\
$( date -d '5 minutes ago' +%s) \
$( date +%s) \
'*' \
5 \
采集应用日志(JSON 格式)# 对于应用日志,我强烈推荐使用 JSON 格式。它避免了正则解析的脆弱性,并能自动完成字段索引。
以 Node.js 为例,使用 pino 配置 JSON 日志输出:
 1
 2
 3
 4
 5
 6
 7
 8
 9
10
11
12
13
14
15
16
17
18
19
// logger.js
const pino = require ( 'pino' );
const logger = pino ({
level : process . env . LOG_LEVEL || 'info' ,
formatters : {
level ( label ) {
return { level : label };
}
},
timestamp : () => `,"timestamp":" ${ new Date (). toISOString () } "` ,
base : {
service : 'order-service' ,
env : process . env . NODE_ENV ,
hostname : require ( 'os' ). hostname ()
}
});
module . exports = logger ;
生成的日志形如:
1
{ "level" : "info" , "timestamp" : "2026-05-20T08:15:32.456Z" , "service" : "order-service" , "env" : "production" , "hostname" : "app-01" , "msg" : "order created" , "orderId" : "ORD-12345" , "userId" : "USR-789" , "amount" : 129.99 , "latencyMs" : 45 }
对应的 Logtail 配置极为简洁,无需正则:
 1
 2
 3
 4
 5
 6
 7
 8
 9
10
11
12
13
14
15
16
17
{
"configName" : "app-json-log-config" ,
"inputType" : "file" ,
"inputDetail" : {
"logType" : "json_log" ,
"logPath" : "/var/log/app" ,
"filePattern" : "*.log" ,
"topicFormat" : "none" ,
"timeKey" : "timestamp" ,
"timeFormat" : "%Y-%m-%dT%H:%M:%S"
},
"outputType" : "LogService" ,
"outputDetail" : {
"projectName" : "prod-webapp" ,
"logstoreName" : "app-log"
}
}
采集系统日志# 对于 syslog、journald 等系统级日志,Logtail 提供原生支持:
 1
 2
 3
 4
 5
 6
 7
 8
 9
10
11
12
13
14
15
16
17
18
{
"configName" : "syslog-config" ,
"inputType" : "file" ,
"inputDetail" : {
"logType" : "common_reg_log" ,
"logPath" : "/var/log" ,
"filePattern" : "syslog*" ,
"topicFormat" : "none" ,
"regex" : "(\\w+ \\d+ \\d+:\\d+:\\d+) (\\S+) (\\S+): (.*)" ,
"key" : [ "timestamp" , "hostname" , "program" , "message" ],
"timeFormat" : "%b %d %H:%M:%S"
},
"outputType" : "LogService" ,
"outputDetail" : {
"projectName" : "prod-webapp" ,
"logstoreName" : "system-log"
}
}
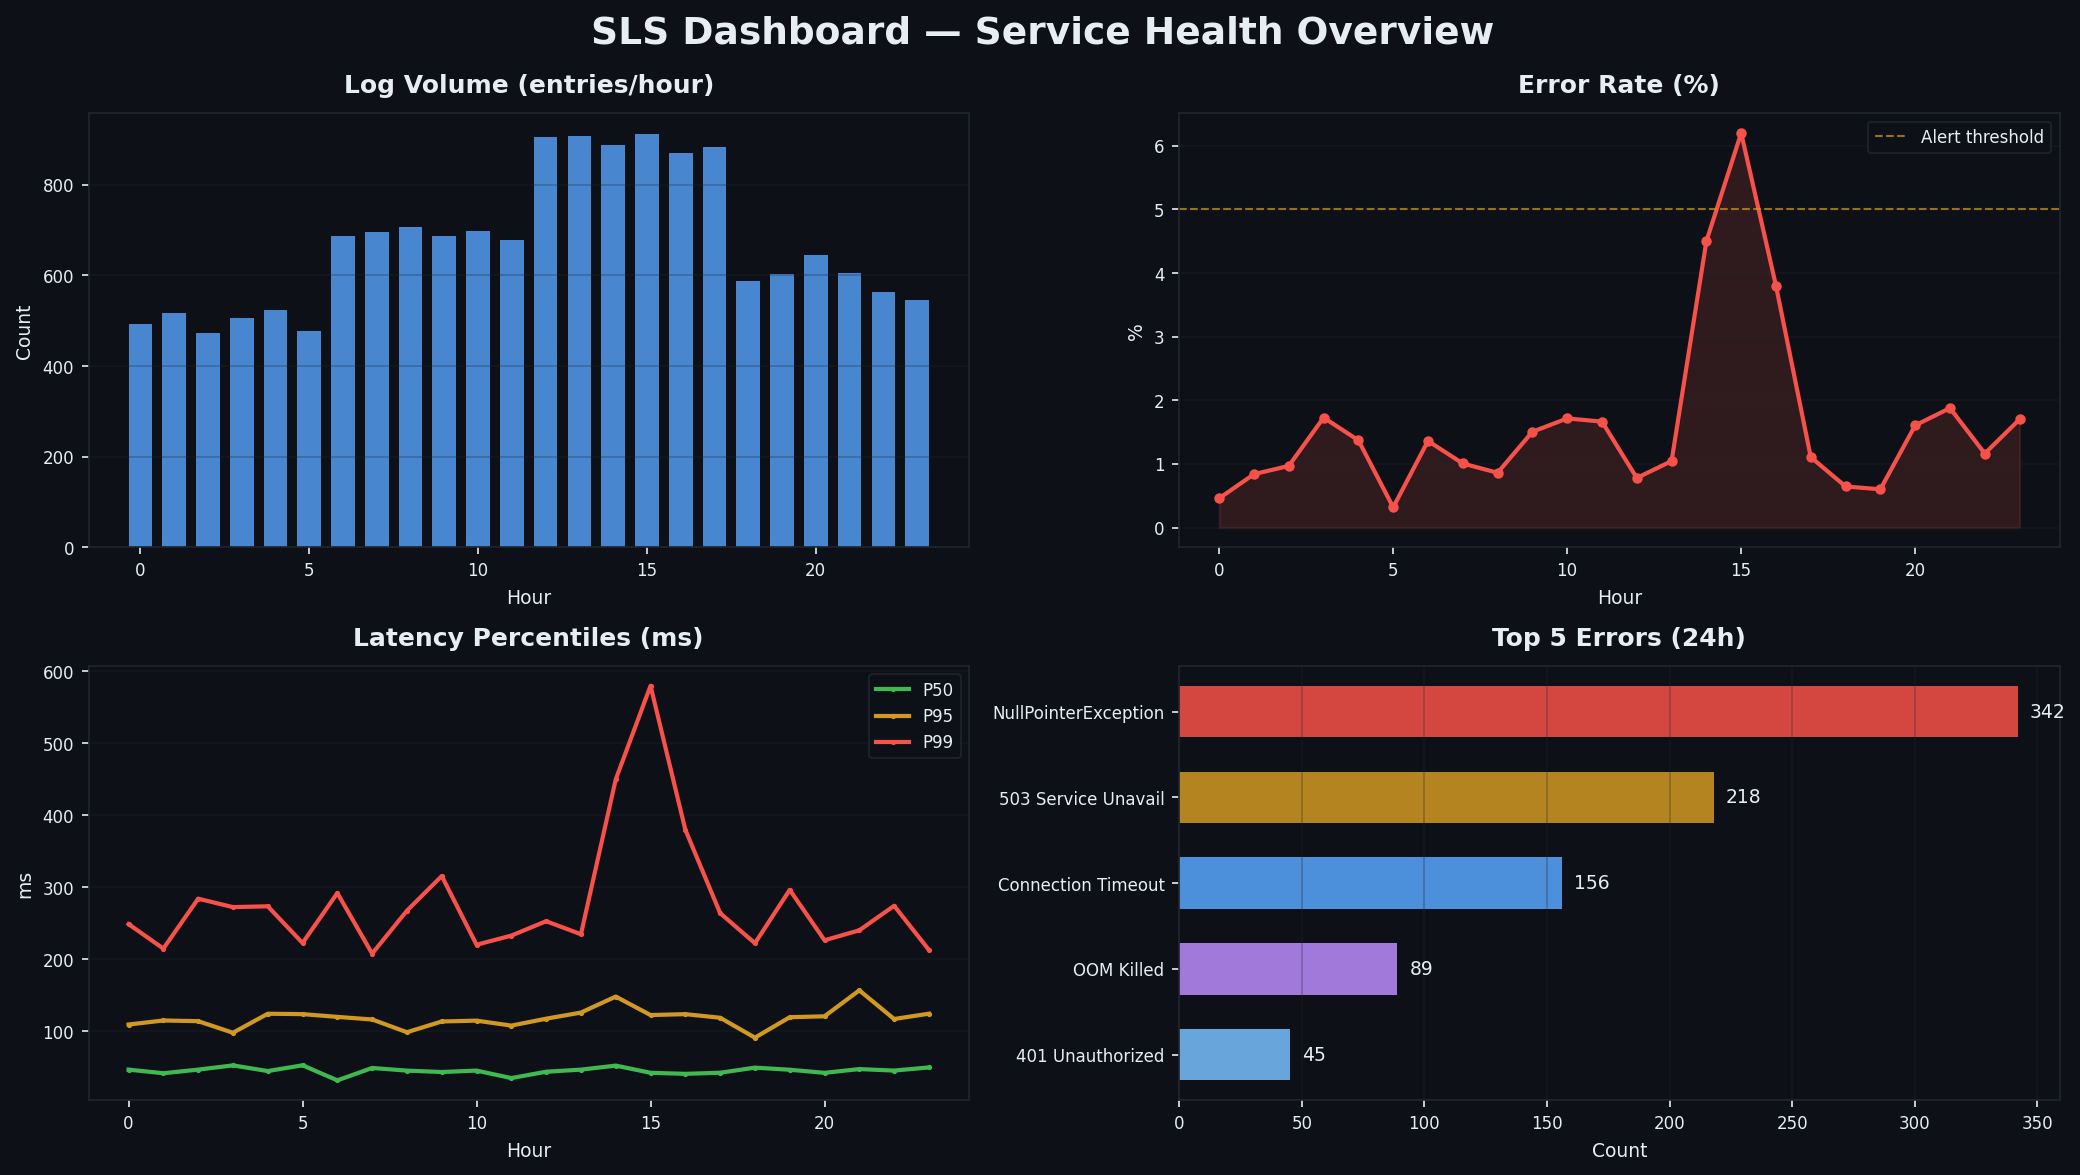
构建仪表盘# 无人查看的仪表盘比没有更危险——它会带来虚假的安全感。关键在于围绕故障排查时真正关心的问题来设计,而非堆砌看似炫酷的指标。
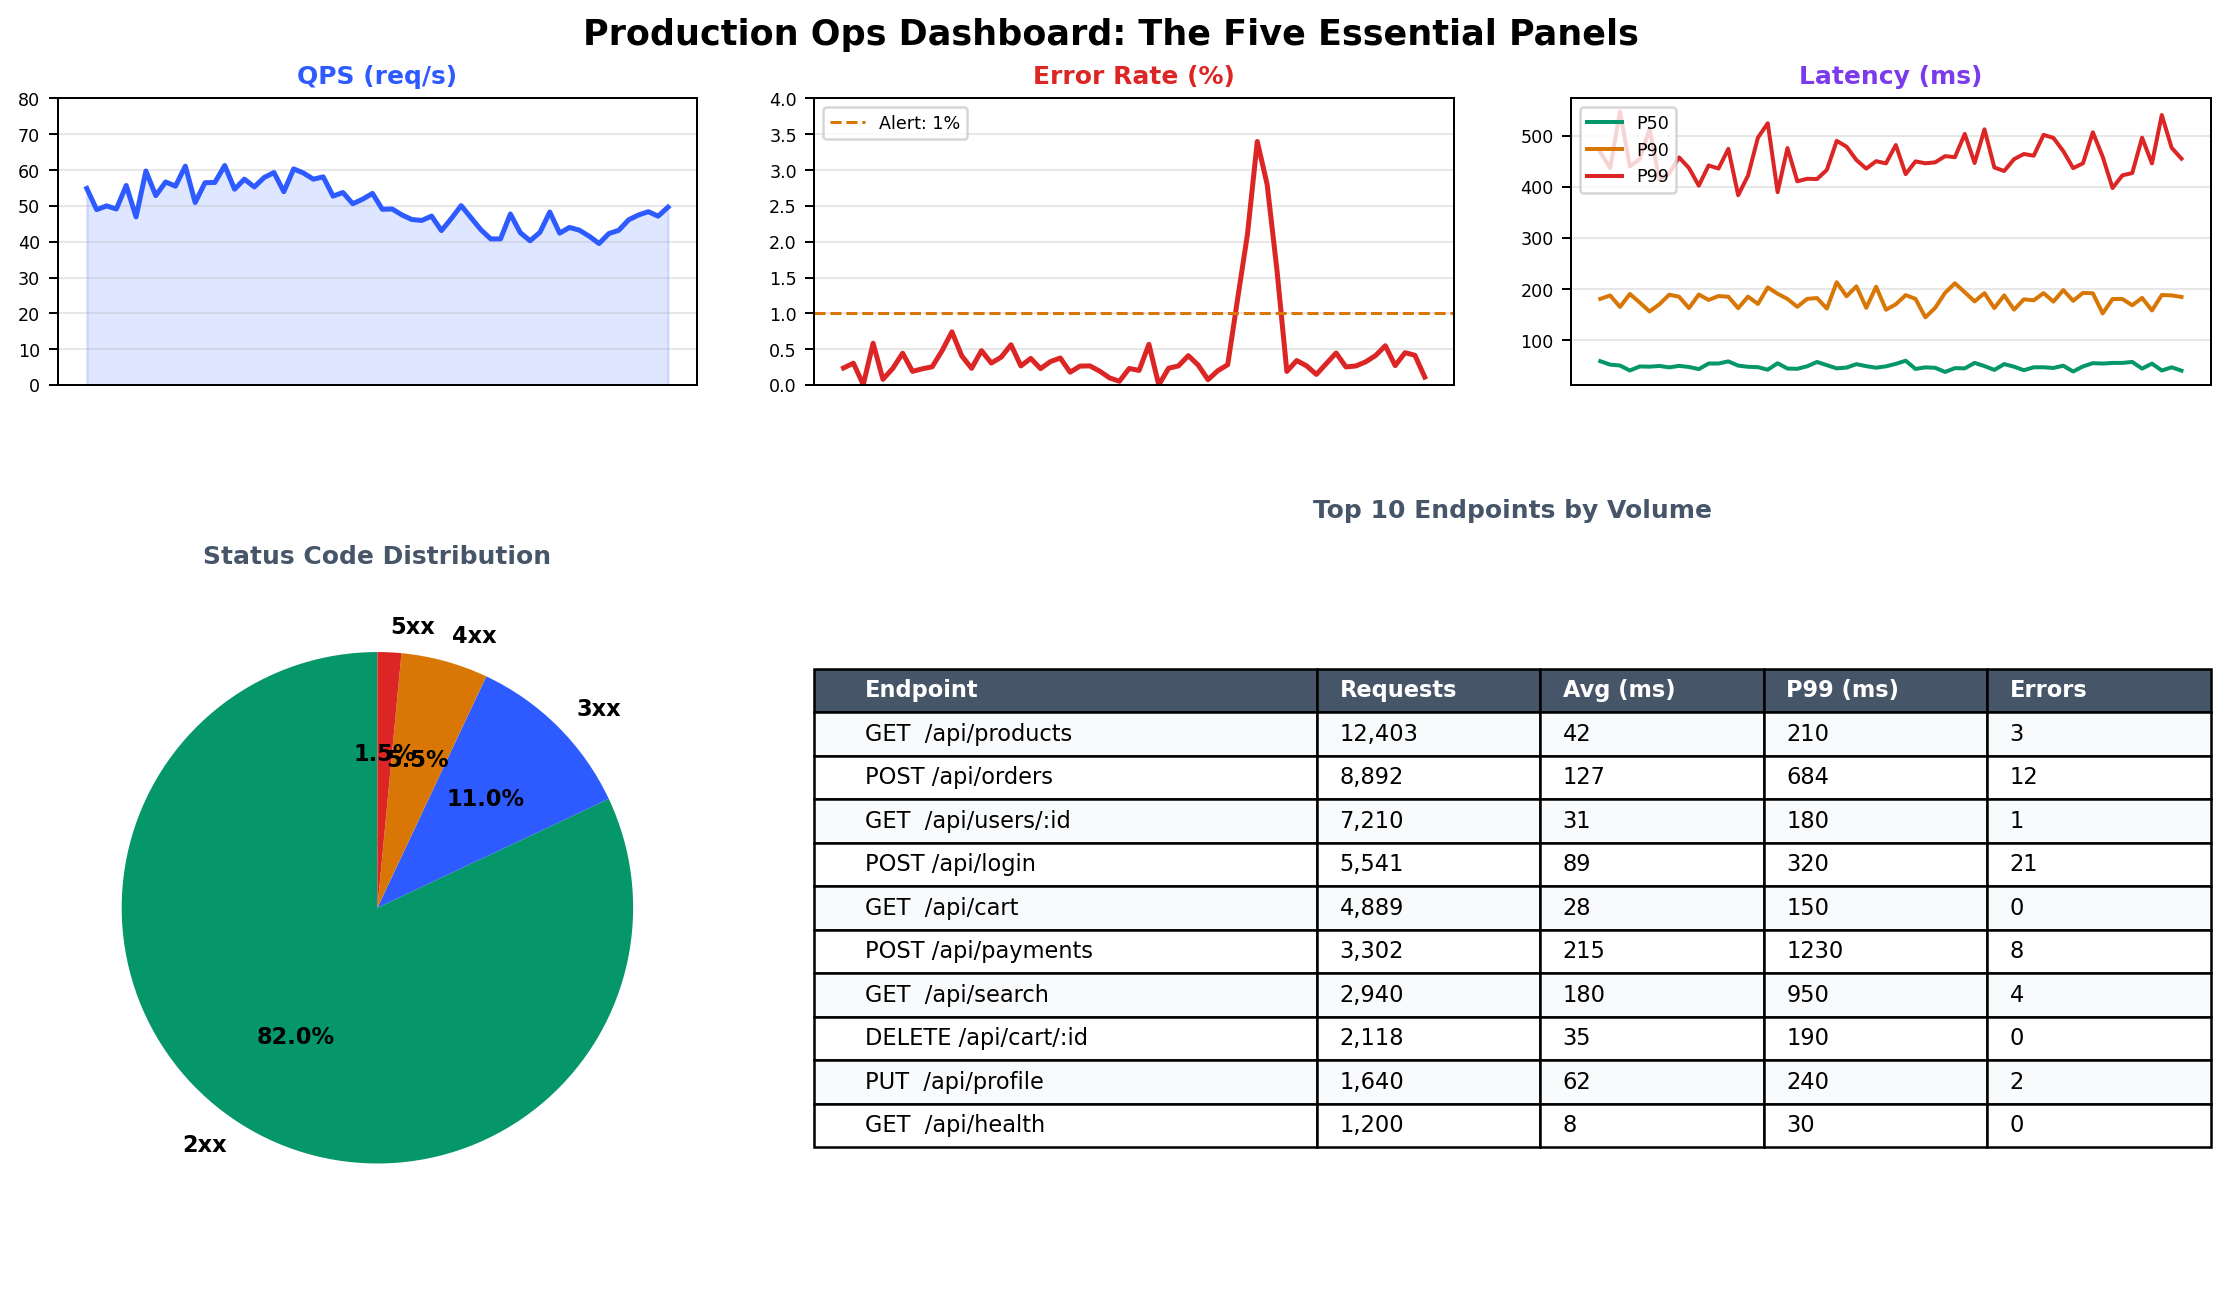
五个核心面板# 每个生产 Web 应用的主仪表盘都应包含以下五个面板:
面板 SLS 查询 作用 QPS 趋势 * | SELECT date_trunc('minute', __time__) as t, count(*)/60.0 as qps GROUP BY t ORDER BY t判断问题是源于流量激增,还是上游故障导致流量骤降 错误率 * | SELECT date_trunc('minute', __time__) as t, round(count_if(status>=500)*100.0/count(*),2) as err_pct GROUP BY t ORDER BY t错误率是否异常?超过 0.1% 即值得关注 P99 延迟 * | SELECT date_trunc('minute', __time__) as t, approx_percentile(request_time, 0.99) as p99 GROUP BY t ORDER BY t服务是否变慢?P99 能暴露平均值掩盖的长尾延迟 热门接口 * | SELECT request_uri, count(*) as cnt, approx_percentile(request_time, 0.50) as p50 GROUP BY request_uri ORDER BY cnt DESC LIMIT 10流量集中在哪些接口?哪些接口响应较慢? 状态码分布 * | SELECT status, count(*) as cnt GROUP BY status ORDER BY cnt DESC是否出现异常的 4xx/5xx 模式?
创建仪表盘# SLS 仪表盘以 JSON 定义。以下是一个精简但实用的运维仪表盘示例:
 1
 2
 3
 4
 5
 6
 7
 8
 9
10
11
12
13
14
15
16
17
18
19
20
21
22
23
24
25
26
27
28
29
30
31
32
33
34
35
36
37
38
39
40
41
42
43
44
45
46
47
48
49
50
51
52
53
54
55
56
57
58
59
60
61
62
63
64
65
66
67
68
69
70
71
72
73
74
75
76
77
78
79
80
81
82
83
84
{
"dashboardName" : "ops-overview" ,
"displayName" : "Production Ops Overview" ,
"charts" : [
{
"title" : "QPS (Requests per Second)" ,
"type" : "line" ,
"search" : {
"logstore" : "nginx-access-log" ,
"topic" : "" ,
"query" : "* | SELECT date_trunc('minute', __time__) as time, round(count(*)/60.0, 1) as qps GROUP BY time ORDER BY time" ,
"start" : "-1h" ,
"end" : "now"
},
"display" : {
"xAxis" : [ "time" ],
"yAxis" : [ "qps" ],
"height" : 300
}
},
{
"title" : "Error Rate (%)" ,
"type" : "line" ,
"search" : {
"logstore" : "nginx-access-log" ,
"topic" : "" ,
"query" : "* | SELECT date_trunc('minute', __time__) as time, round(count_if(status >= 500) * 100.0 / count(*), 2) as error_rate GROUP BY time ORDER BY time" ,
"start" : "-1h" ,
"end" : "now"
},
"display" : {
"xAxis" : [ "time" ],
"yAxis" : [ "error_rate" ],
"height" : 300
}
},
{
"title" : "P50 / P90 / P99 Latency (seconds)" ,
"type" : "line" ,
"search" : {
"logstore" : "nginx-access-log" ,
"topic" : "" ,
"query" : "* | SELECT date_trunc('minute', __time__) as time, approx_percentile(request_time, 0.50) as p50, approx_percentile(request_time, 0.90) as p90, approx_percentile(request_time, 0.99) as p99 GROUP BY time ORDER BY time" ,
"start" : "-1h" ,
"end" : "now"
},
"display" : {
"xAxis" : [ "time" ],
"yAxis" : [ "p50" , "p90" , "p99" ],
"height" : 300
}
},
{
"title" : "Status Code Distribution" ,
"type" : "pie" ,
"search" : {
"logstore" : "nginx-access-log" ,
"topic" : "" ,
"query" : "* | SELECT CASE WHEN status >= 200 AND status < 300 THEN '2xx' WHEN status >= 300 AND status < 400 THEN '3xx' WHEN status >= 400 AND status < 500 THEN '4xx' WHEN status >= 500 THEN '5xx' END as code_class, count(*) as cnt GROUP BY code_class ORDER BY cnt DESC" ,
"start" : "-1h" ,
"end" : "now"
},
"display" : {
"xAxis" : [ "code_class" ],
"yAxis" : [ "cnt" ],
"height" : 300
}
},
{
"title" : "Top 10 Endpoints by Volume" ,
"type" : "table" ,
"search" : {
"logstore" : "nginx-access-log" ,
"topic" : "" ,
"query" : "* | SELECT request_uri, count(*) as requests, round(avg(request_time), 3) as avg_latency, approx_percentile(request_time, 0.99) as p99_latency, count_if(status >= 500) as errors GROUP BY request_uri ORDER BY requests DESC LIMIT 10" ,
"start" : "-1h" ,
"end" : "now"
},
"display" : {
"height" : 300
}
}
]
}
通过 CLI 创建:
1
2
3
4
aliyun sls CreateDashboard \
\
\
实战建议 :先在 SLS 控制台使用可视化编辑器交互式构建图表,再导出 JSON 定义用于版本控制。手写仪表盘 JSON 极其繁琐。控制台的查询探索器支持即时反馈,便于在正式嵌入面板前调试查询语句。
CloudMonitor:基础设施指标与告警# SLS 负责日志,CloudMonitor 则专注于指标——即那些反映基础设施健康状况的数值时间序列。CloudMonitor 对所有阿里云资源默认启用。一旦你创建 ECS、RDS 或 SLB,基础指标采集即自动开始。
内置指标# CloudMonitor 为每台 ECS 实例自动采集以下指标:
指标 描述 采集间隔 CPUUtilizationCPU 使用率(%) 60 秒 MemoryUsedPercent内存使用率(%) 60 秒 DiskReadBPS / DiskWriteBPS磁盘 I/O 吞吐量 60 秒 DiskReadIOPS / DiskWriteIOPS磁盘 I/O 操作数 60 秒 InternetInRate / InternetOutRate公网网络吞吐量 60 秒 IntranetInRate / IntranetOutRateVPC 内网吞吐量 60 秒 disk_usage_percent磁盘空间使用率(需安装代理) 60 秒 load_5m5 分钟负载平均值(需安装代理) 60 秒
前六项由 Hypervisor 层直接提供,无需代理;后两项需在实例上安装 CloudMonitor 代理。可与 Logtail 一同安装:
 1
 2
 3
 4
 5
 6
 7
 8
 9
10
11
# Install CloudMonitor agent
ARGUS_VERSION = 3.5.9
REGION_ID = cn-hangzhou
wget "http://cms-download.aliyun.com/cms-go-client/ $ARGUS_VERSION /cms-go-client.linux-amd64.tar.gz"
tar xzf cms-go-client.linux-amd64.tar.gz
sudo ./cms-go-client.linux-amd64/cloudmonitor --install
sudo ./cms-go-client.linux-amd64/cloudmonitor --start
# Verify
sudo ./cms-go-client.linux-amd64/cloudmonitor --status
其他云服务无需代理即可提供关键指标:
服务 关键指标 RDS CPU、内存、连接数、IOPS、磁盘使用率、每秒慢查询数 SLB 活跃连接数、新建连接数、QPS、健康主机数、延迟 OSS 请求数、带宽、可用性、首字节延迟 Redis (Tair) CPU、内存使用率、连接数、QPS、命中率、驱逐数 NAT Gateway 活跃连接数、带宽、包速率
自定义指标# 对于 CloudMonitor 无法自动采集的应用层指标,可通过 API 推送自定义指标:
 1
 2
 3
 4
 5
 6
 7
 8
 9
10
11
12
13
14
15
16
17
18
19
20
21
# Push a custom metric: order processing latency
aliyun cms PutCustomMetric \
'[
{
"groupId": 12345,
"metricName": "order_processing_latency",
"dimensions": {
"service": "order-service",
"env": "production"
},
"time": "' $( date +%s%3N) '",
"type": 0,
"values": {
"Average": 245,
"Maximum": 1830,
"Minimum": 12,
"SampleCount": 150,
"Sum": 36750
}
}
]'
在代码中,建议批量推送而非逐请求上报(例如每 60 秒推送一次):
 1
 2
 3
 4
 5
 6
 7
 8
 9
10
11
12
13
14
15
16
17
18
19
20
21
22
23
24
25
26
27
28
29
30
31
32
33
34
35
36
37
38
39
40
41
42
43
44
45
46
47
48
49
50
51
52
53
54
55
// metrics-reporter.js
const Core = require ( '@alicloud/pop-core' );
const client = new Core ({
accessKeyId : process . env . ALIBABA_CLOUD_ACCESS_KEY_ID ,
accessKeySecret : process . env . ALIBABA_CLOUD_ACCESS_KEY_SECRET ,
endpoint : 'https://metrics.cn-hangzhou.aliyuncs.com' ,
apiVersion : '2019-01-01'
});
class MetricsBuffer {
constructor ( groupId , flushIntervalMs = 60000 ) {
this . groupId = groupId ;
this . buffer = {};
setInterval (() => this . flush (), flushIntervalMs );
}
record ( metricName , value , dimensions = {}) {
const key = ` ${ metricName } : ${ JSON . stringify ( dimensions ) } ` ;
if ( ! this . buffer [ key ]) {
this . buffer [ key ] = { metricName , dimensions , values : [] };
}
this . buffer [ key ]. values . push ( value );
}
async flush () {
const metricList = [];
for ( const [ key , entry ] of Object . entries ( this . buffer )) {
if ( entry . values . length === 0 ) continue ;
const sorted = entry . values . sort (( a , b ) => a - b );
metricList . push ({
groupId : this . groupId ,
metricName : entry . metricName ,
dimensions : entry . dimensions ,
time : Date . now (). toString (),
type : 0 ,
values : {
Average : sorted . reduce (( a , b ) => a + b , 0 ) / sorted . length ,
Maximum : sorted [ sorted . length - 1 ],
Minimum : sorted [ 0 ],
SampleCount : sorted . length ,
Sum : sorted . reduce (( a , b ) => a + b , 0 )
}
});
}
this . buffer = {};
if ( metricList . length === 0 ) return ;
await client . request ( 'PutCustomMetric' , {
MetricList : JSON . stringify ( metricList )
});
}
}
module . exports = MetricsBuffer ;
事件监控# CloudMonitor 还能捕获系统事件——即资源上发生的离散事件(非连续指标),如 ECS 重启、磁盘错误、计划维护或安全告警。
需重点关注的事件包括:
事件 含义 建议操作 Instance:SystemFailure.Reboot因宿主机故障被阿里云重启 检查应用是否正常恢复 Disk:Stalled磁盘 I/O 停滞,可能为存储后端问题 监控是否存在数据损坏 Instance:PerformanceLimited突发性能实例(t 系列)耗尽 CPU 积分 升级实例类型或切换至固定性能型 SecurityGroup:AuthorizeFailed连接被安全组规则拦截 确认是否为预期行为或配置错误
可通过订阅接收事件通知:
 1
 2
 3
 4
 5
 6
 7
 8
 9
10
11
12
13
aliyun cms PutEventRule \
\
'{
"product": "ECS",
"eventTypeList": [
"StatusNotification",
"SystemFailure.Reboot",
"SystemMaintenance.Reboot",
"Disk:Stalled"
]
}' \
'["ops-team"]' \
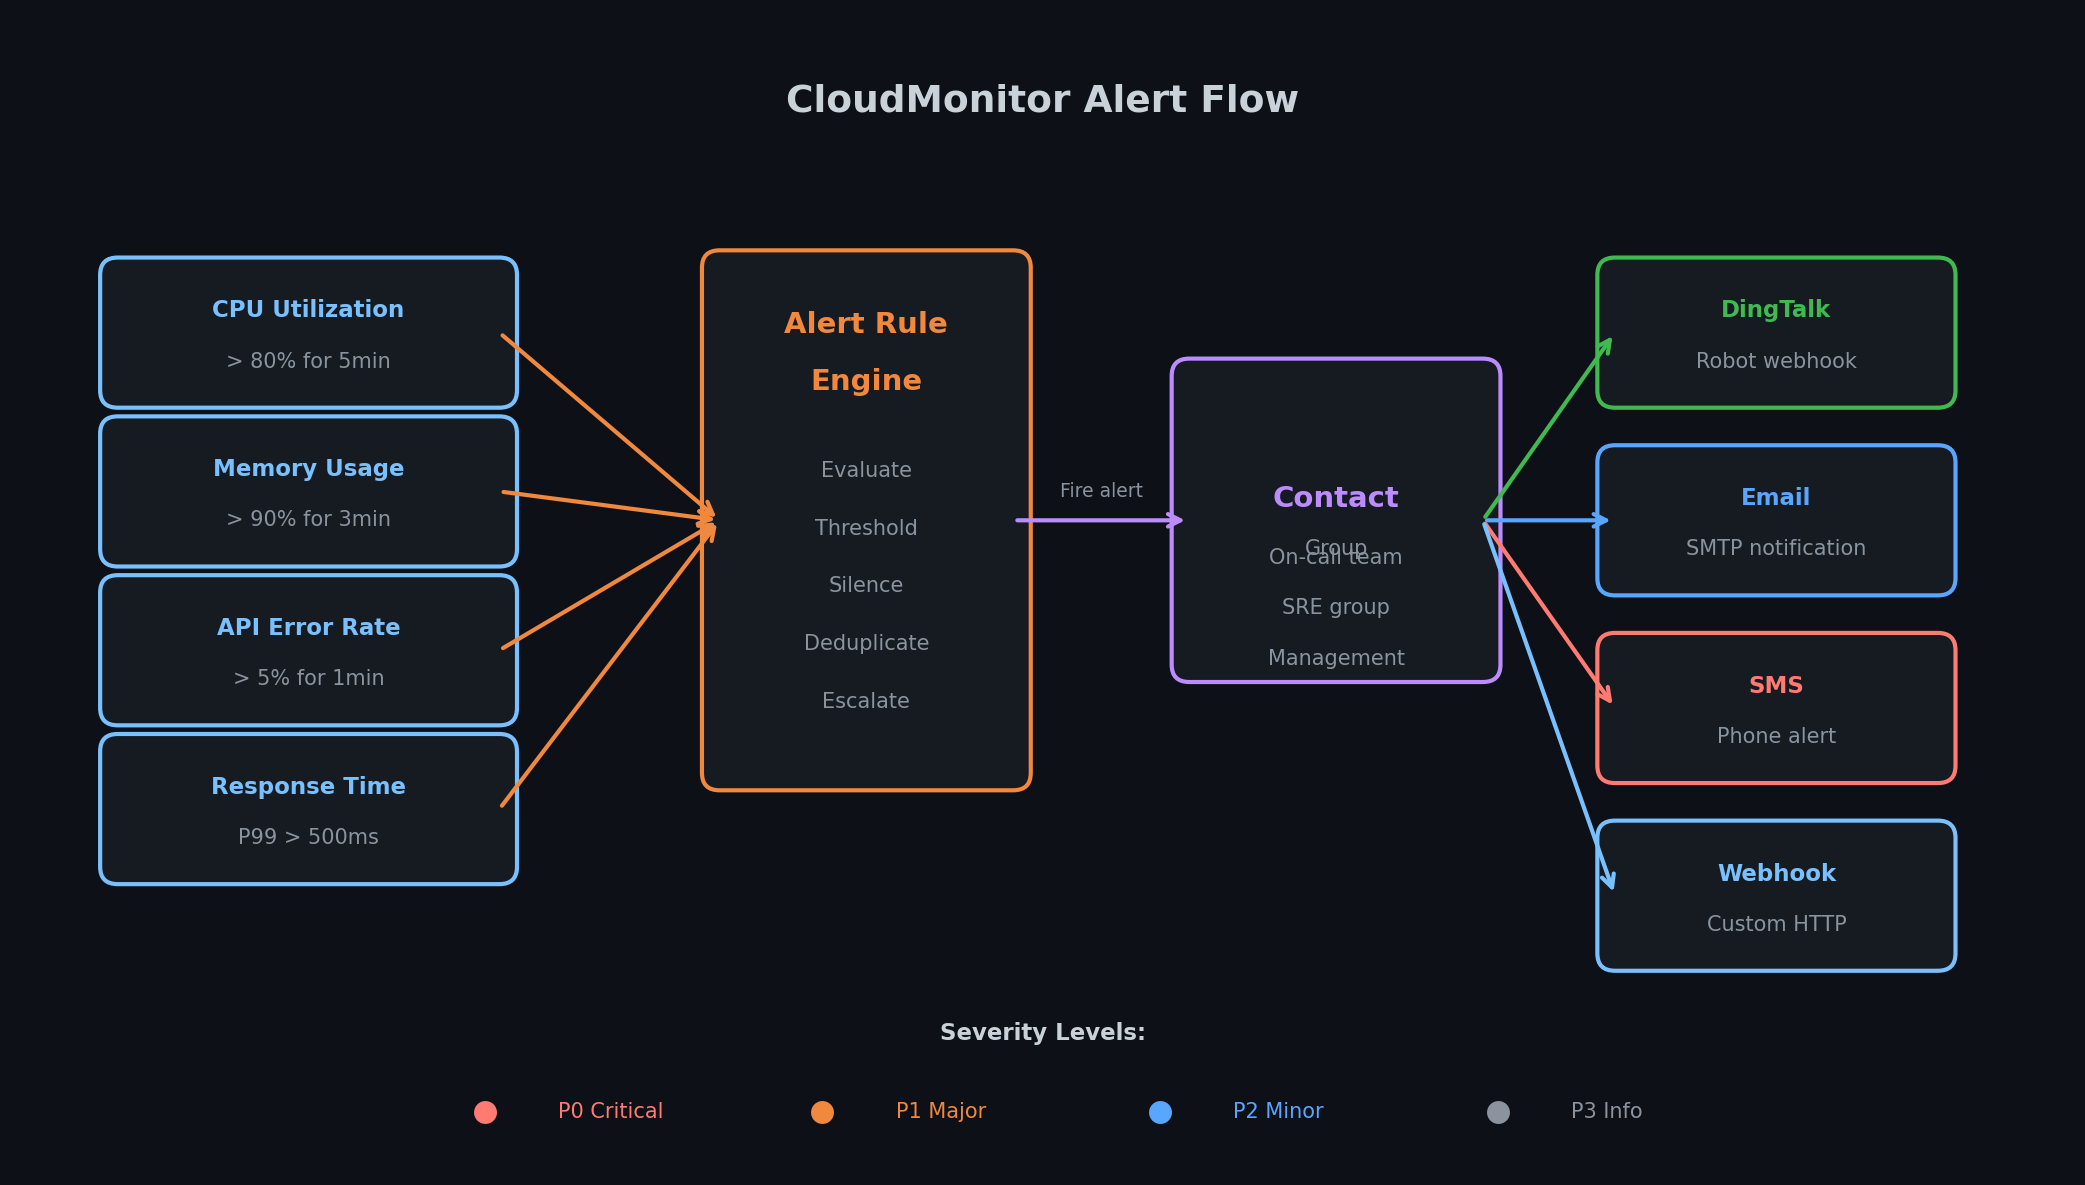
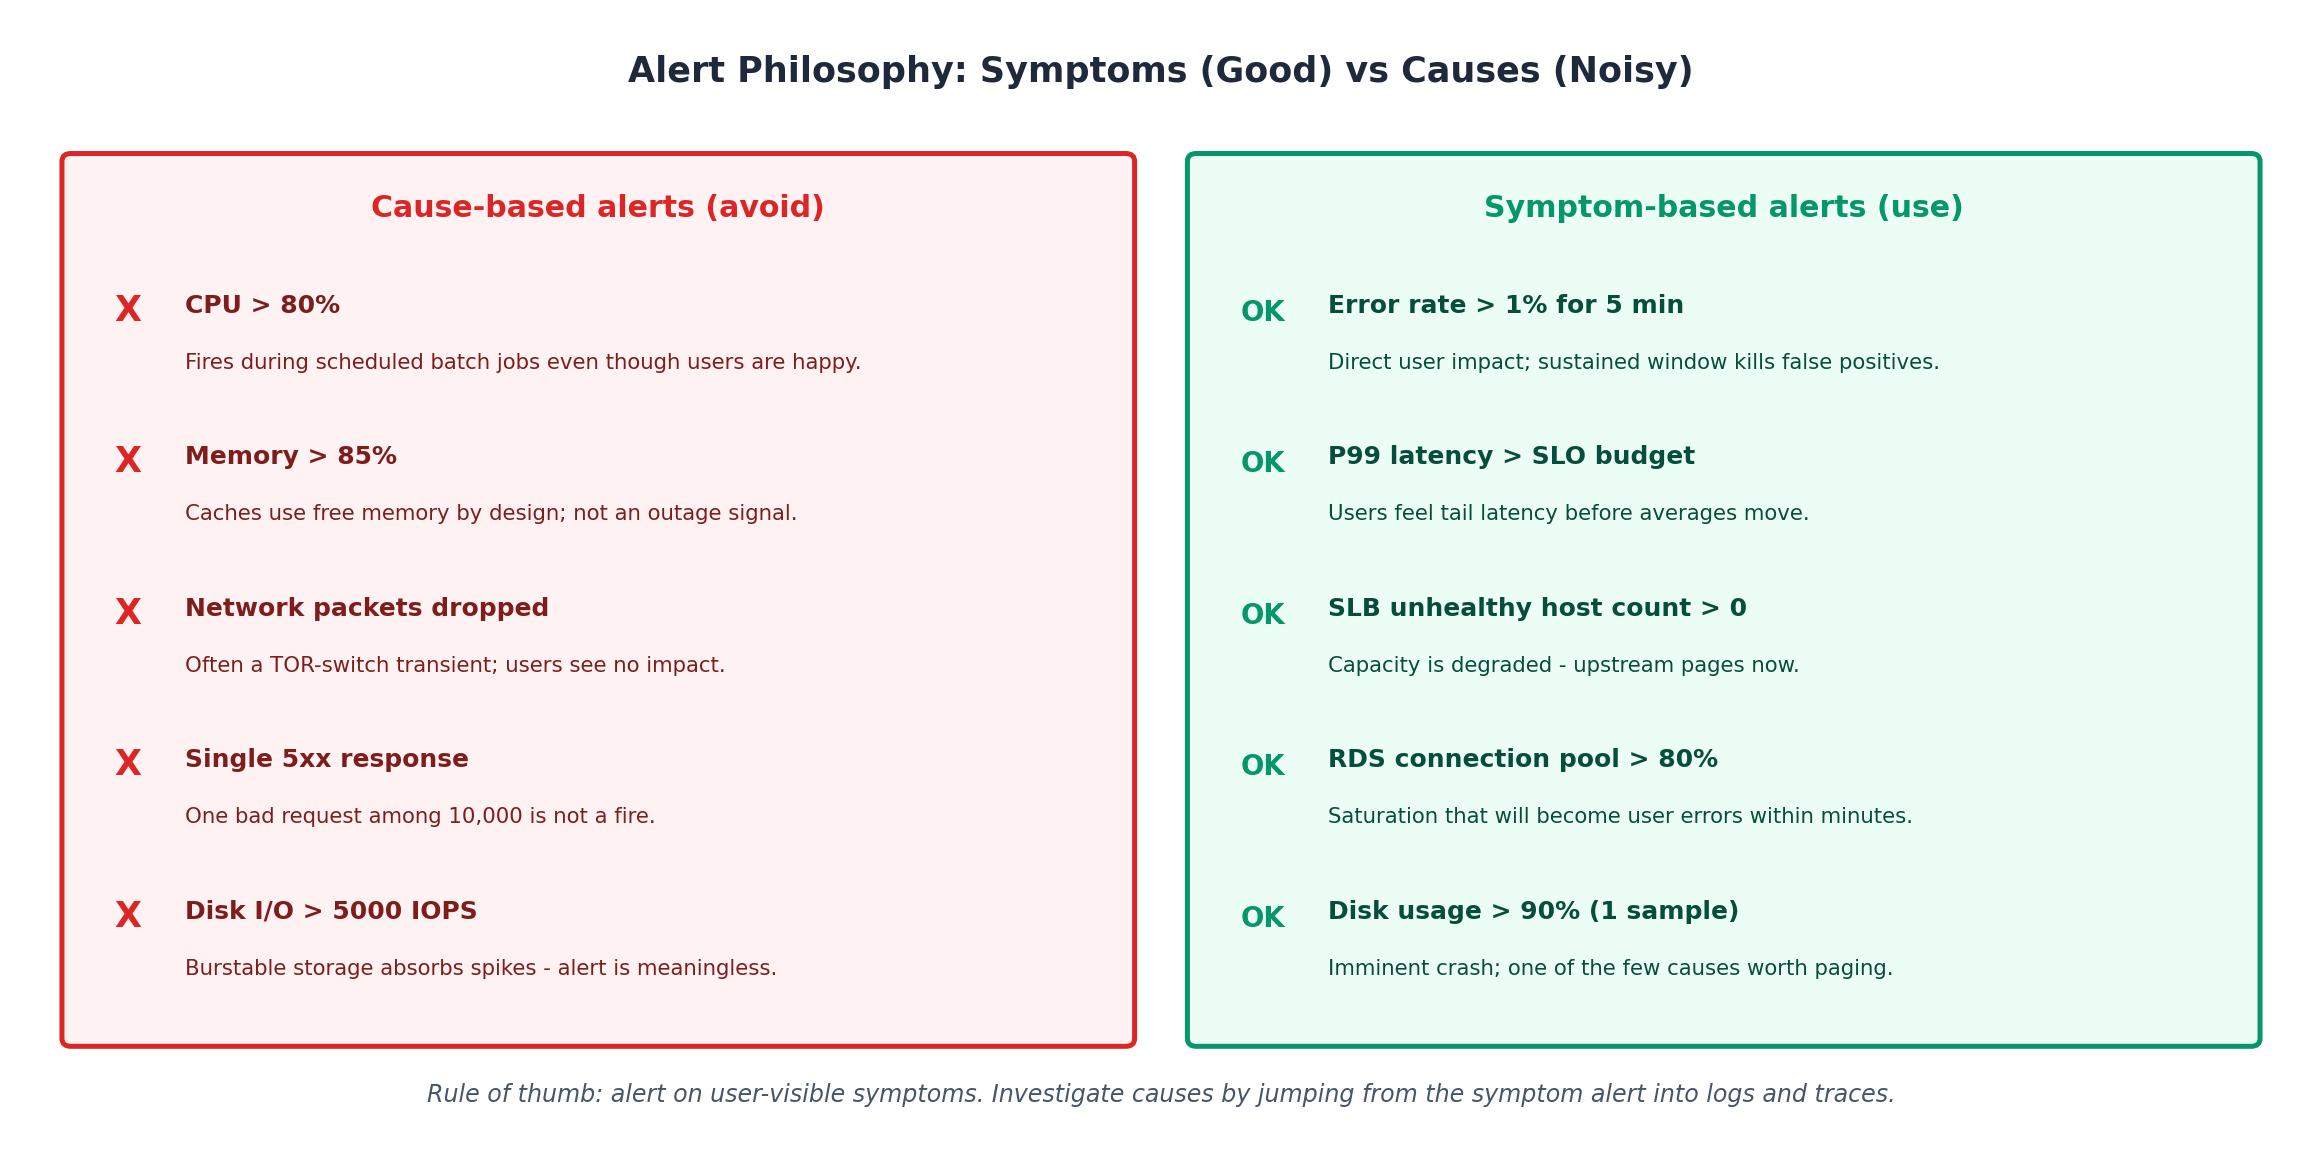
告警配置# 告警是连接可观测性与行动的桥梁。合理的告警能在错误率飙升时凌晨 3 点叫醒你;糟糕的告警也会在同样时间把你吵醒,只因备份期间 CPU 短暂冲高至 81% 后迅速回落。设定恰当的告警阈值是一门艺术,以下经验法则经实践验证有效:
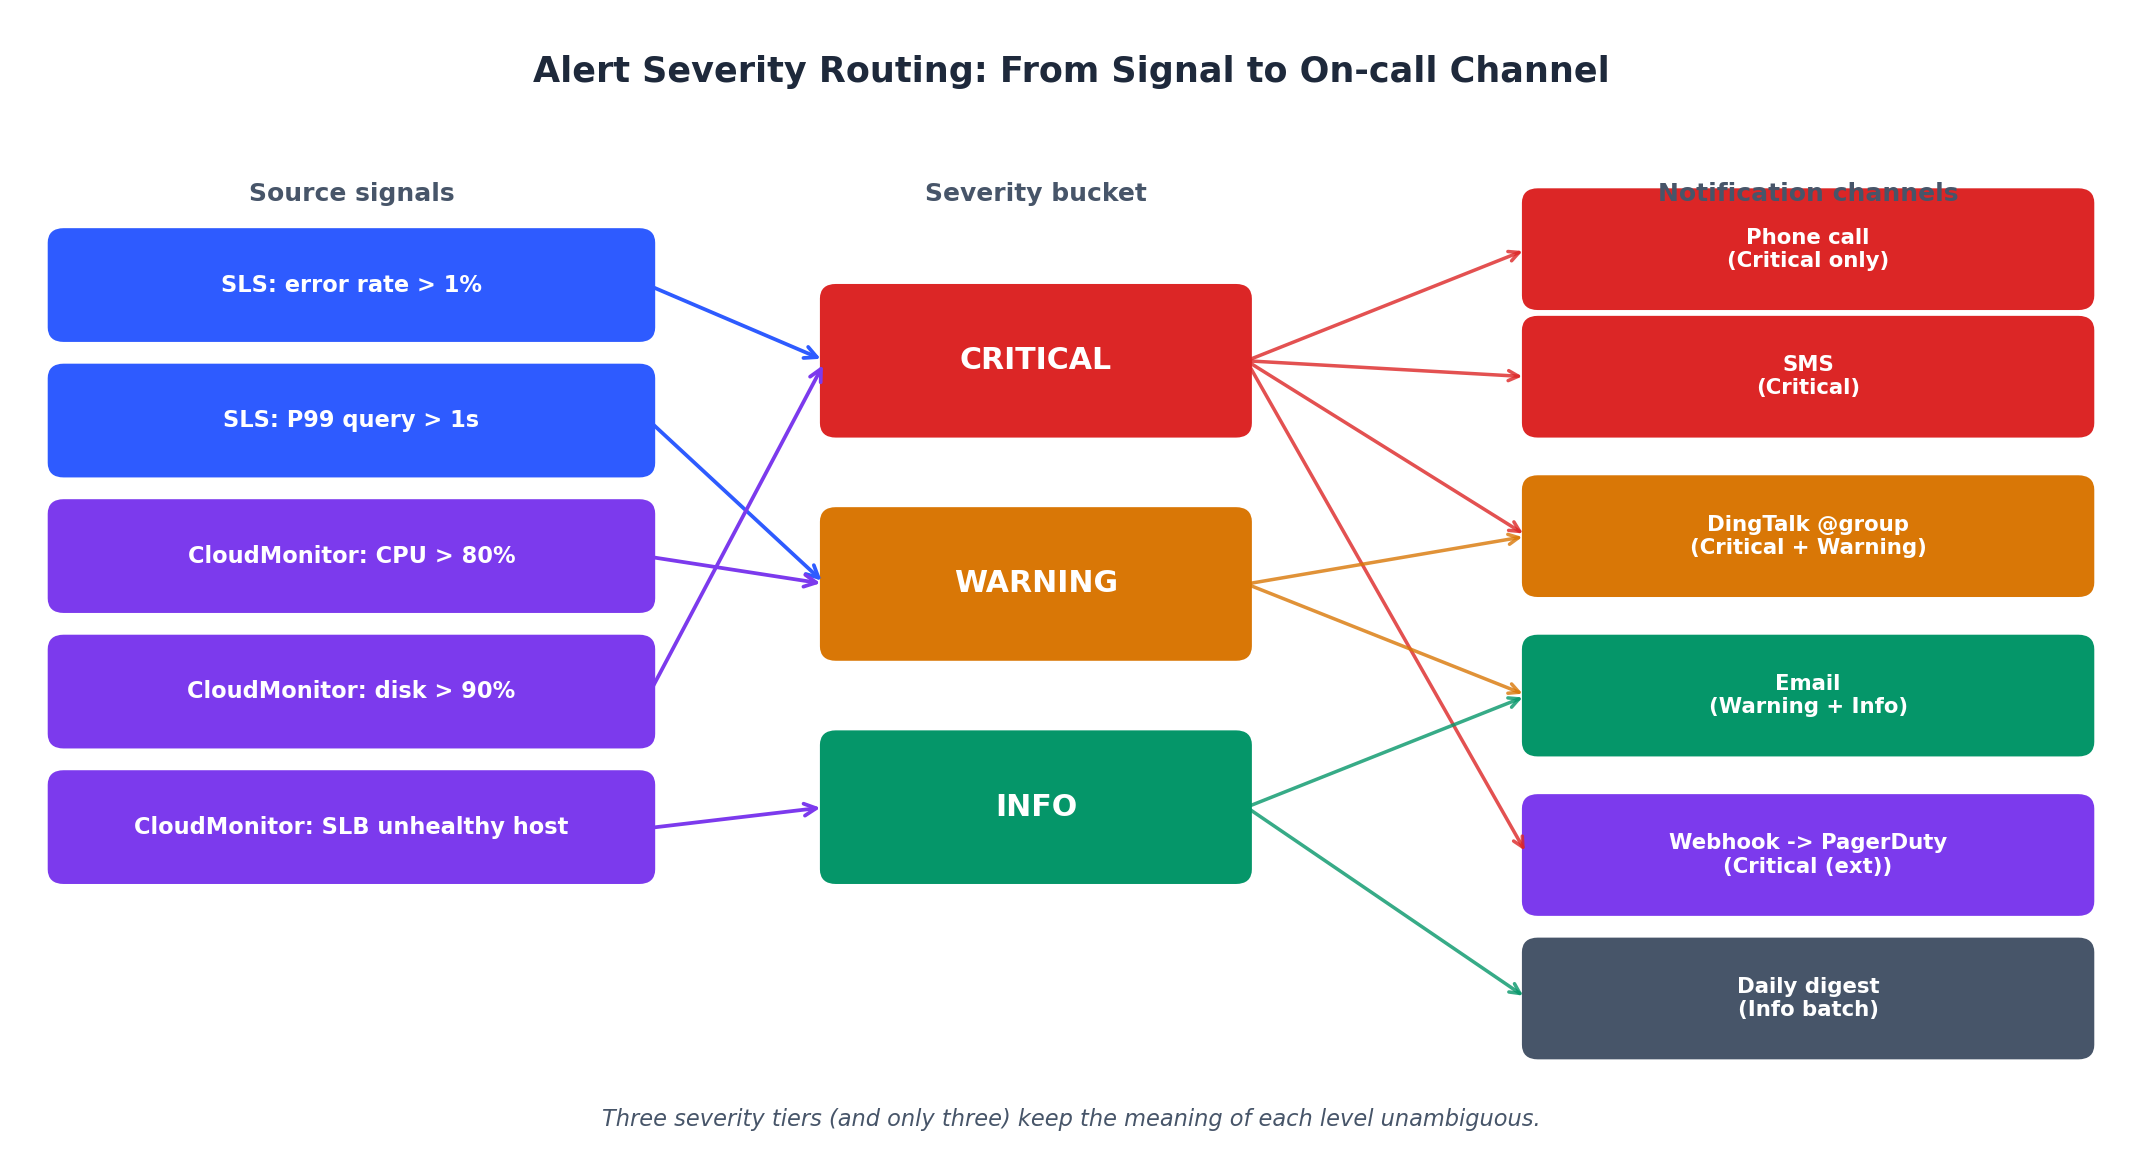
告警设计原则# 告警症状,而非原因 :应告警“错误率 > 1%”,而非“CPU > 80%”。高 CPU 本身未必影响用户体验,而错误率直接反映用户可见的问题。使用持续阈值 :切勿基于单点数据告警。要求异常状态持续 3–5 分钟,以过滤瞬时抖动。仅设三个严重级别 :Critical(立即通知)、Warning(数小时内处理)、Info(记录备查)。超过三级将导致团队混淆。维护期间静音 :在已知维护窗口内抑制告警,避免破坏告警可信度。
设置告警规则# 每个生产系统都应配置以下四条核心告警:
1. 高错误率(Critical)
 1
 2
 3
 4
 5
 6
 7
 8
 9
10
11
12
13
14
15
16
17
18
19
20
21
22
23
24
25
26
27
28
29
30
31
32
33
34
35
36
37
# SLS Alert: Error rate exceeds 1% for 5 minutes
aliyun sls CreateAlert \
\
'{
"name": "high-error-rate",
"displayName": "High Error Rate (>1%)",
"description": "5xx error rate exceeds 1% over 5 minutes",
"schedule": {
"type": "FixedRate",
"interval": "1m"
},
"configuration": {
"type": "default",
"queryList": [
{
"project": "prod-webapp",
"logstore": "nginx-access-log",
"query": "* | SELECT round(count_if(status >= 500) * 100.0 / count(*), 2) as error_rate, count(*) as total WHERE __time__ > unix_timestamp() - 300",
"timeSpanType": "Custom",
"start": "-5m",
"end": "now"
}
],
"condition": "error_rate > 1 && total > 100",
"threshold": 1,
"noDataFire": false,
"sendResolved": true,
"notificationList": [
{
"type": "DingTalk",
"serviceUri": "https://oapi.dingtalk.com/robot/send?access_token=YOUR_TOKEN",
"content": "CRITICAL: Error rate is ${error_rate}% (${total} requests in last 5min)"
}
]
}
}' \
total > 100 条件可避免低流量期误报。例如仅 3 个请求失败 1 个,虽错误率达 33%,但实际无意义。
2. 持续高 CPU(Warning)
 1
 2
 3
 4
 5
 6
 7
 8
 9
10
11
12
13
# CloudMonitor Alert: CPU > 80% for 5 minutes
aliyun cms PutResourceMetricRule \
\
"High CPU Utilization" \
\
\
'["ops-team"]' \
'[{"instanceId":"i-bp1xxxxxxxxx"}]' \
\
\
80 \
5 \
60
Times: 5 表示需连续 5 个评估周期(每 60 秒一次,共 5 分钟)均满足条件。短暂流量高峰引发的 CPU 飙升不会触发此告警。
3. 磁盘空间不足(Warning)
 1
 2
 3
 4
 5
 6
 7
 8
 9
10
11
12
13
14
15
16
17
aliyun cms PutResourceMetricRule \
\
"Low Disk Space" \
\
\
'["ops-team"]' \
'[{"instanceId":"i-bp1xxxxxxxxx"}]' \
\
\
80 \
3 \
60 \
\
\
90 \
1 \
60
设置两级阈值:磁盘使用率达 80%(持续)时告警,达 90% 时升级为 Critical。磁盘写满是我见过最常见也最易预防的宕机原因。
4. 数据库慢查询(Warning)
 1
 2
 3
 4
 5
 6
 7
 8
 9
10
11
12
13
14
15
16
17
18
19
20
21
22
23
24
25
26
27
28
29
30
31
32
33
34
35
36
37
# SLS Alert: P99 query time exceeds 1 second
aliyun sls CreateAlert \
\
'{
"name": "slow-queries",
"displayName": "Slow Database Queries",
"description": "P99 query time exceeds 1 second over 10 minutes",
"schedule": {
"type": "FixedRate",
"interval": "5m"
},
"configuration": {
"type": "default",
"queryList": [
{
"project": "prod-webapp",
"logstore": "slow-query-log",
"query": "* | SELECT approx_percentile(query_time, 0.99) as p99_query_time, count(*) as slow_query_count WHERE __time__ > unix_timestamp() - 600",
"timeSpanType": "Custom",
"start": "-10m",
"end": "now"
}
],
"condition": "p99_query_time > 1",
"threshold": 1,
"noDataFire": false,
"sendResolved": true,
"notificationList": [
{
"type": "DingTalk",
"serviceUri": "https://oapi.dingtalk.com/robot/send?access_token=YOUR_TOKEN",
"content": "WARNING: P99 query time is ${p99_query_time}s (${slow_query_count} slow queries in last 10min)"
}
]
}
}' \
联系人组与通知渠道# CloudMonitor 通过联系人组路由告警通知。创建组并添加通知渠道:
 1
 2
 3
 4
 5
 6
 7
 8
 9
10
11
12
13
14
# Create a contact group
aliyun cms PutContactGroup \
\
'["engineer-a", "engineer-b", "on-call"]' \
"Production operations team"
# Create a contact with DingTalk and email
aliyun cms PutContact \
\
'{
"Mail": "engineer-a@company.com",
"DingWebHook": "https://oapi.dingtalk.com/robot/send?access_token=YOUR_TOKEN"
}' \
"Engineer A - primary on-call"
支持的通知渠道包括:
渠道 适用场景 Email 非紧急告警、每日摘要 DingTalk webhook 团队协同、事故响应 SMS 需立即处理的 Critical 告警 电话 生产完全不可用(慎用) Webhook (HTTP) 集成 PagerDuty、Slack 或自定义系统
静音期 :对计划内维护窗口,应在告警规则上设置静音期。这优于直接禁用告警——事件仍会被记录,只是不会在已知时段打扰你。
ARMS:应用实时监控服务# ARMS 补全了可观测性的最后一环:链路追踪。SLS 告诉你“发生了什么”,CloudMonitor 告诉你“系统层面的影响”,而 ARMS 则精准定位“问题出在应用的哪个环节”。
ARMS 的核心能力# ARMS 是一款 APM(应用性能监控)平台,提供:
分布式追踪 :跨服务、数据库、缓存和消息队列追踪请求,精确识别耗时环节。服务拓扑 :自动发现服务间依赖关系,直观展示调用量与错误率。异常诊断 :自动捕获并聚合异常,附带堆栈、频率及受影响用户信息。慢事务分析 :深入分析具体慢请求,查看完整调用链(含数据库查询与外部 API 调用)。ARMS 支持多种语言的自动埋点:
语言 代理类型 自动埋点范围 Java ByteBuddy 代理 Spring、Dubbo、gRPC、JDBC、Redis、HTTP 客户端 Node.js npm 包 Express、Koa、MySQL、Redis、HTTP、gRPC Python pip 包 Django、Flask、SQLAlchemy、Redis、requests Go SDK net/http、gRPC、database/sql、go-redis PHP 扩展 Laravel、ThinkPHP、MySQLi、cURL
“自动埋点”意味着无需修改应用代码。代理会拦截框架层调用并自动生成追踪片段(spans)。只需在启动命令中加入代理,追踪数据便会自动上报。
安装 ARMS Agent(Node.js)# 针对本系列中运行在 ECS 上的 Node.js 应用:
1
2
3
4
5
6
7
# Install the ARMS Node.js agent
npm install @alicloud/china-arms-apm --save
# Set environment variables
export ARMS_APP_NAME = order-service
export ARMS_LICENSE_KEY = your-license-key-from-console
export ARMS_REGION_ID = cn-hangzhou
在应用入口文件顶部(早于任何其他 import)添加 agent 引用:
1
2
3
4
5
6
7
// app.js - this MUST be the first line
require ( '@alicloud/china-arms-apm' ). default ({ appName : 'order-service' });
// everything else follows
const express = require ( 'express' );
const app = express ();
// ... rest of your application
Java 应用更简单——只需添加 JVM 参数:
1
2
3
4
java -javaagent:/path/to/arms-agent.jar \
= order-service \
= your-license-key \
查看链路追踪# Agent 启动后,ARMS 会为每个请求生成追踪记录。每条追踪由多个 spans 组成(每个操作如 HTTP 调用、数据库查询对应一个 span),形成树状结构,完整呈现请求生命周期。
典型 API 请求的追踪如下:
 1
 2
 3
 4
 5
 6
 7
 8
 9
10
11
Trace : abc - 123 - def ( total : 234 ms )
├── [ order - service ] POST / api / orders 0 - 234 ms
│ ├── [ order - service ] MySQL : SELECT * FROM users 12 - 18 ms
│ ├── [ order - service ] Redis : GET user : 789 : cart 19 - 21 ms
│ ├── [ order - service ] MySQL : INSERT INTO orders 22 - 89 ms
│ ├── [ order - service ] HTTP : POST payment - service / charge 90 - 210 ms
│ │ ├── [ payment - service ] POST / charge 95 - 205 ms
│ │ │ ├── [ payment - service ] MySQL : SELECT balance 100 - 105 ms
│ │ │ ├── [ payment - service ] HTTP : POST alipay . com 106 - 195 ms
│ │ │ └── [ payment - service ] MySQL : UPDATE balance 196 - 203 ms
│ └── [ order - service ] Redis : DEL user : 789 : cart 211 - 213 ms
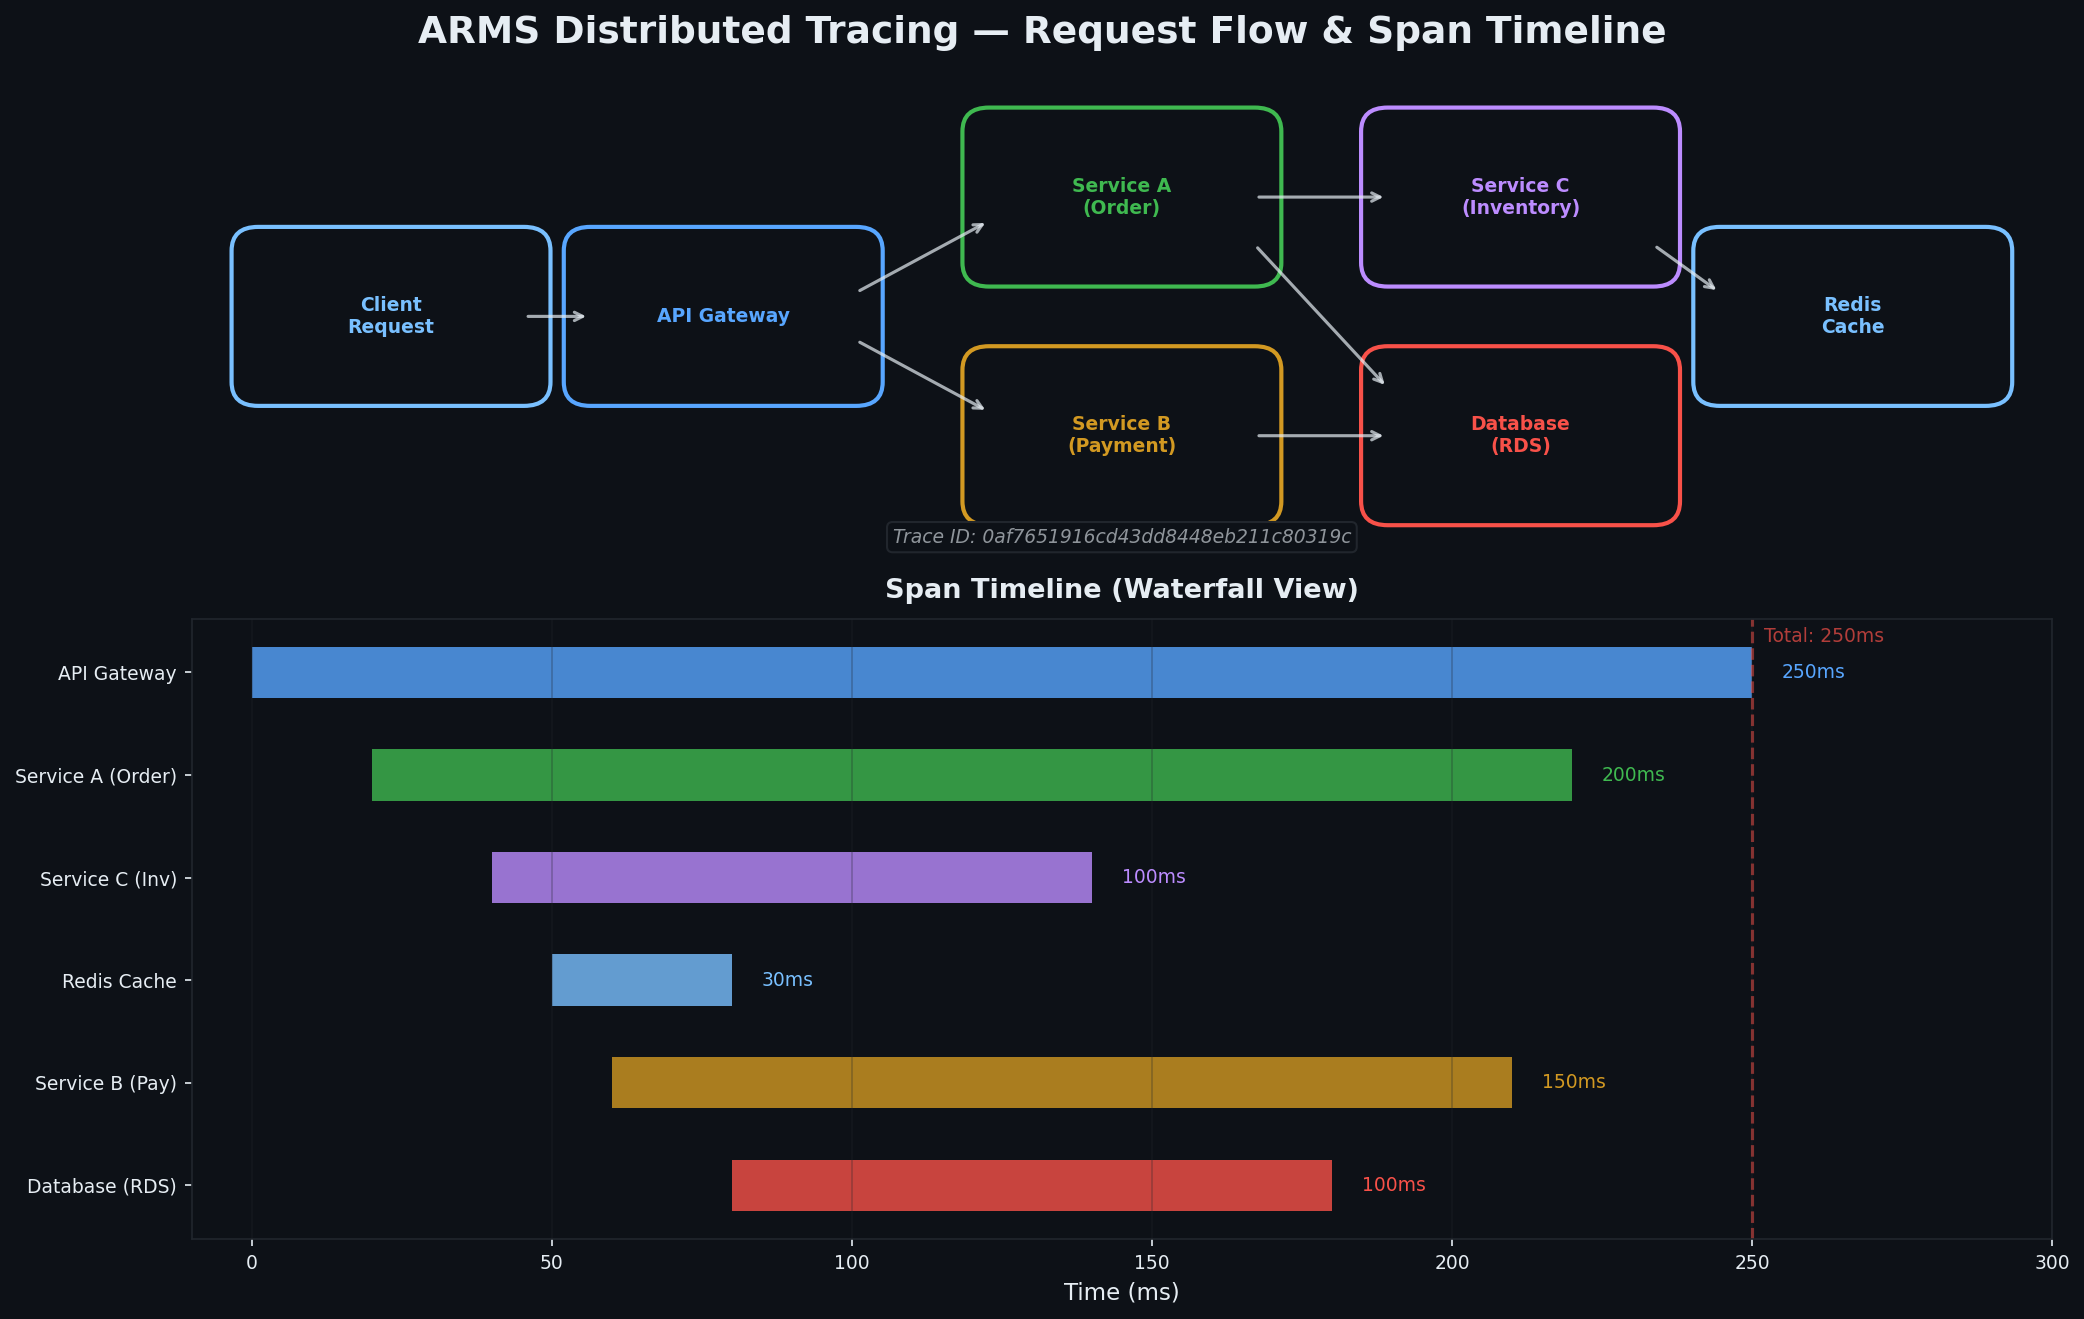
从中可见:支付服务调用支付宝耗时 89ms(属不可控外部依赖);数据库 INSERT 耗时 67ms(若平时更快则需排查)。总耗时 234ms 对结账流程尚可接受,但若达 2340ms,则可精准定位问题 span。
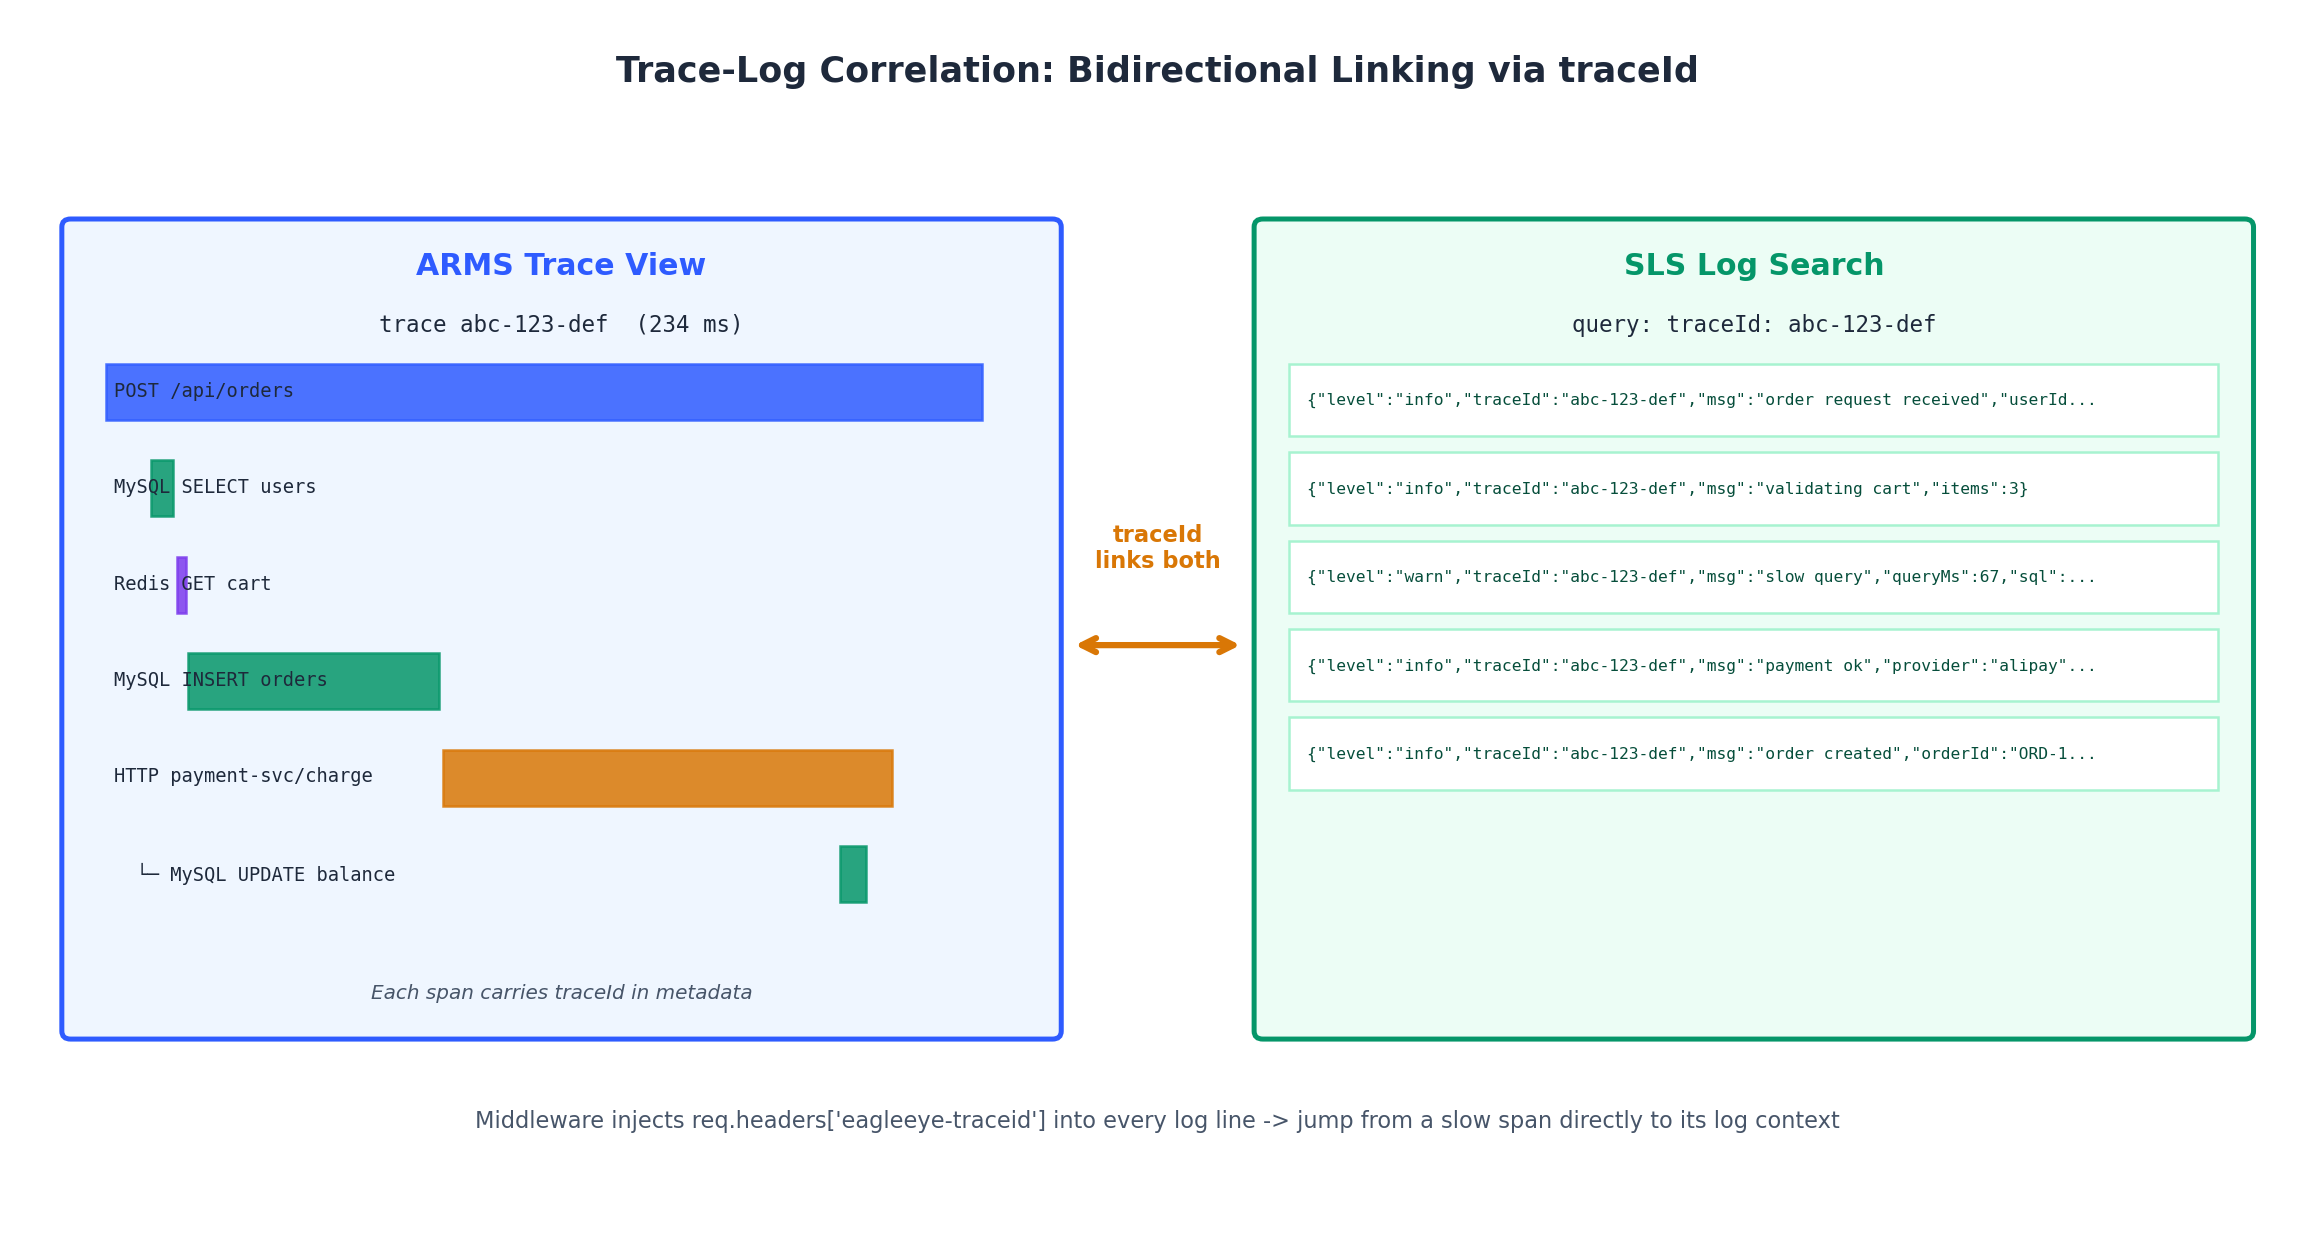
链路与日志关联# 真正的威力在于 ARMS 追踪与 SLS 日志的双向关联。当追踪显示某数据库查询缓慢时,你可立即查看对应日志,了解触发用户、参数及查询计划。
通过在日志中包含 trace ID 实现关联:
 1
 2
 3
 4
 5
 6
 7
 8
 9
10
11
12
13
// middleware to inject trace ID into logs
app . use (( req , res , next ) => {
const traceId = req . headers [ 'eagleeye-traceid' ] || 'no-trace' ;
req . logger = logger . child ({ traceId });
next ();
});
// In your route handlers, use req.logger
app . post ( '/api/orders' , async ( req , res ) => {
req . logger . info ({ userId : req . user . id }, 'creating order' );
// ... business logic
req . logger . info ({ orderId : order . id , latencyMs : elapsed }, 'order created' );
});
此后在 SLS 中可搜索特定 trace 的所有日志:
同时,ARMS 中每个 span 也会反向链接至 SLS 日志条目。这种双向跳转极大加速了生产问题排查。
解决方案:全栈可观测性搭建# 现在将前述内容整合为一套完整部署流程。假设你已按本系列前文搭建好架构:ECS 实例置于 SLB 后,后端连接 RDS 数据库。
第一步:在所有 ECS 实例安装代理# 通过 cloud-init 脚本或 Ansible playbook,在每台应用服务器安装双代理:
 1
 2
 3
 4
 5
 6
 7
 8
 9
10
11
12
13
14
15
16
17
18
19
20
21
22
23
24
25
26
27
28
29
30
31
32
33
34
35
36
37
#!/bin/bash
# install-observability.sh
# Run on each ECS instance in the app tier
set -euo pipefail
REGION = cn-hangzhou
SLS_PROJECT = prod-webapp
echo "=== Installing Logtail ==="
wget -q http://logtail-release-${ REGION } .oss-${ REGION } -internal.aliyuncs.com/linux64/logtail.sh -O /tmp/logtail.sh
chmod 755 /tmp/logtail.sh
sudo /tmp/logtail.sh install ${ REGION }
# Set machine group identity
sudo mkdir -p /etc/ilogtail
echo "prod-app-servers" | sudo tee /etc/ilogtail/user_defined_id
# Restart Logtail to pick up identity
sudo /etc/init.d/ilogtaild restart
echo "=== Installing CloudMonitor Agent ==="
ARGUS_VERSION = 3.5.9
wget -q "http://cms-download.aliyun.com/cms-go-client/ ${ ARGUS_VERSION } /cms-go-client.linux-amd64.tar.gz" -O /tmp/cms-agent.tar.gz
cd /tmp && tar xzf cms-agent.tar.gz
sudo /tmp/cms-go-client.linux-amd64/cloudmonitor --install
sudo /tmp/cms-go-client.linux-amd64/cloudmonitor --start
echo "=== Installing ARMS Node.js Agent ==="
cd /opt/app
npm install @alicloud/china-arms-apm --save
echo "=== Verifying ==="
sudo /etc/init.d/ilogtaild status
sudo /tmp/cms-go-client.linux-amd64/cloudmonitor --status
echo "All agents installed successfully."
第二步:配置日志采集# 为所有日志源应用 Logtail 配置:
 1
 2
 3
 4
 5
 6
 7
 8
 9
10
11
12
13
14
15
16
17
18
19
20
21
22
23
24
25
26
27
28
29
30
31
32
33
34
35
36
# Create SLS project and logstores
aliyun sls CreateProject --body '{"projectName":"prod-webapp","description":"Production logs"}' \
for STORE in nginx-access-log app-log system-log slow-query-log; do
aliyun sls CreateLogStore --project prod-webapp \
"{\"logstoreName\":\" ${ STORE } \",\"ttl\":30,\"shardCount\":2,\"autoSplit\":true,\"maxSplitShard\":8}" \
done
# Create machine group (user-defined identity)
aliyun sls CreateMachineGroup --project prod-webapp \
'{
"groupName":"prod-app-servers",
"machineIdentifyType":"userdefined",
"groupAttribute":{"externalName":"prod-app-servers","groupTopic":""},
"machineList":["prod-app-servers"]
}' \
# Apply collection configs (nginx, app JSON, syslog)
aliyun sls CreateConfig --project prod-webapp --body @nginx-access-config.json \
aliyun sls ApplyConfigToMachineGroup --project prod-webapp \
\
aliyun sls CreateConfig --project prod-webapp --body @app-json-log-config.json \
aliyun sls ApplyConfigToMachineGroup --project prod-webapp \
\
# Create indexes for nginx logs
aliyun sls CreateIndex --project prod-webapp --logstore nginx-access-log \
第三步:设置 CloudMonitor 告警# 防患于未然,提前配置关键告警:
 1
 2
 3
 4
 5
 6
 7
 8
 9
10
11
12
13
14
15
16
17
18
19
20
21
22
23
24
25
26
27
28
29
30
31
32
33
34
35
36
37
38
39
40
41
42
43
44
45
46
47
48
49
50
51
52
53
54
55
56
57
58
59
60
61
62
63
64
65
66
67
# Create contact group
aliyun cms PutContactGroup \
\
'["primary-oncall"]'
# ECS alerts
for INSTANCE_ID in i-bp1xxxxxxxxx i-bp1yyyyyyyyy; do
# CPU alert
aliyun cms PutResourceMetricRule \
"cpu-high- ${ INSTANCE_ID } " \
"High CPU - ${ INSTANCE_ID } " \
\
\
'["ops-team"]' \
"[{\"instanceId\":\" ${ INSTANCE_ID } \"}]" \
\
\
80 \
5 \
60
# Disk alert
aliyun cms PutResourceMetricRule \
"disk-high- ${ INSTANCE_ID } " \
"Low Disk - ${ INSTANCE_ID } " \
\
\
'["ops-team"]' \
"[{\"instanceId\":\" ${ INSTANCE_ID } \"}]" \
\
\
80 \
3 \
\
\
90 \
1 \
60
done
# RDS alerts
aliyun cms PutResourceMetricRule \
\
"RDS Connection Pool Exhaustion" \
\
\
'["ops-team"]' \
'[{"instanceId":"rm-bp1xxxxxxxxx"}]' \
\
\
80 \
3 \
60
# SLB health check alert
aliyun cms PutResourceMetricRule \
\
"SLB Unhealthy Backend Servers" \
\
\
'["ops-team"]' \
'[{"instanceId":"lb-bp1xxxxxxxxx"}]' \
\
\
0 \
2 \
60
第四步:配置 SLS 仪表盘与告警# 1
2
3
4
5
6
7
8
9
10
11
12
13
# Create the ops dashboard
aliyun sls CreateDashboard --project prod-webapp \
\
# Create SLS alerts for error rate and slow queries
aliyun sls CreateAlert --project prod-webapp \
\
aliyun sls CreateAlert --project prod-webapp \
\
第五步:验证系统运行状态# 1
2
3
4
5
6
7
8
9
10
11
12
13
14
15
16
17
18
19
20
21
22
23
24
25
26
27
28
29
30
31
32
# 1. Check Logtail is collecting logs
aliyun sls GetLogs --project prod-webapp --logstore nginx-access-log \
$( date -d '5 minutes ago' +%s) --to $( date +%s) \
'*' --line 3 --endpoint cn-hangzhou.log.aliyuncs.com
# 2. Check CloudMonitor agent metrics
aliyun cms DescribeMetricLast \
\
\
'[{"instanceId":"i-bp1xxxxxxxxx"}]'
# 3. Generate test traffic and verify dashboard
for i in $( seq 1 100) ; do
curl -s -o /dev/null -w "%{http_code}\n" https://your-app.com/api/health
done
# 4. Trigger a test alert (temporarily lower threshold)
aliyun cms PutResourceMetricRule \
\
"Test CPU Alert" \
\
\
'["ops-team"]' \
'[{"instanceId":"i-bp1xxxxxxxxx"}]' \
\
\
1 \
1 \
60
# Wait for the test alert, then delete it
# aliyun cms DeleteMetricRules --Id '["cpu-high-test"]'
完整架构# 完成上述五步后,你的可观测性体系如下所示:
 1
 2
 3
 4
 5
 6
 7
 8
 9
10
11
12
13
14
15
16
17
18
19
20
21
22
23
24
25
26
27
28
29
30
                        ┌───────────────────────────────────────────┐
                        │              SLS Dashboard                │
                        │  QPS | Errors | Latency | Top Endpoints  │
                        └──────────┬───────────────┬────────────────┘
                                   │               │
                    ┌──────────────┴───┐    ┌──────┴──────────┐
                    │   SLS Alerts     │    │ CloudMonitor     │
                    │  error rate >1%  │    │  CPU > 80%       │
                    │  slow queries    │    │  disk > 80%      │
                    └──────┬───────────┘    │  RDS conn > 80%  │
                           │               │  SLB unhealthy   │
                    ┌──────┴───────┐       └──────┬───────────┘
                    │              │               │
              ┌─────▼─────┐  ┌────▼──────┐  ┌────▼──────────┐
              │ SLS       │  │ SLS       │  │ DingTalk /    │
              │ Logstore  │  │ Logstore  │  │ Email / SMS   │
              │ nginx     │  │ app       │  │ Webhook       │
              └─────▲─────┘  └────▲──────┘  └───────────────┘
                    │             │
              ┌─────┴─────────────┴──────────────────────┐
              │              Logtail Agent                │
              │    /var/log/nginx/    /var/log/app/       │
              ├──────────────────────────────────────────┤
              │              ARMS Agent                   │
              │    Traces → ARMS Console                 │
              ├──────────────────────────────────────────┤
              │           CloudMonitor Agent              │
              │    CPU, Memory, Disk → CloudMonitor       │
              └──────────────────────────────────────────┘
                         ECS Instance (App Tier)
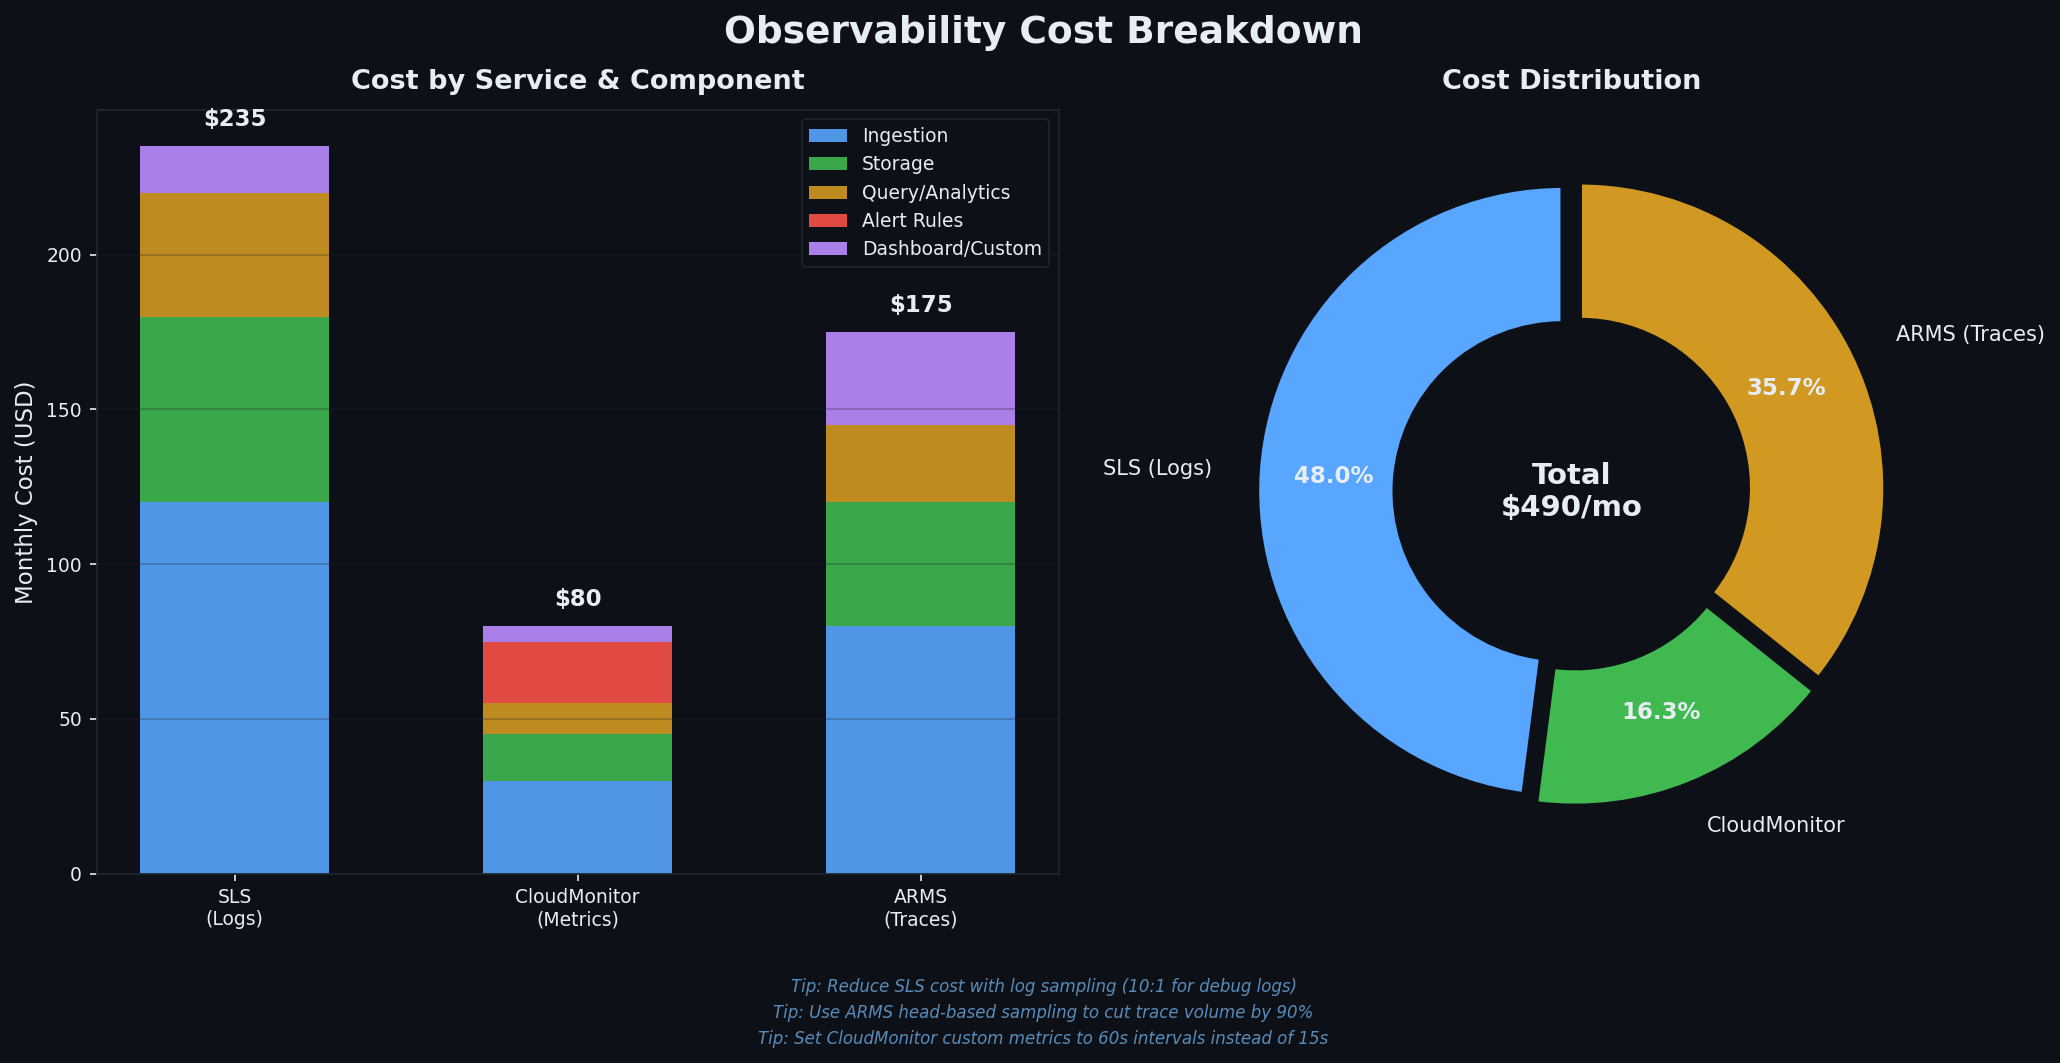
可观测性并非免费,成本容易在不经意间累积。以下为小型生产环境(2 台 ECS,中等流量)的月度成本估算:
组件 免费额度 典型月成本 SLS 写入 500 MB/天 50–200 元(取决于日志量) SLS 存储 含在写入中 已包含 SLS 索引 含在写入中 约为存储成本的 2 倍 CloudMonitor 基础指标免费 内置指标 0 元;自定义指标 10–50 元 ARMS 15 天免费试用 100–500 元(取决于追踪量)
成本优化建议 :
合理设置保留周期 :访问日志通常无需超过 30 天,系统日志保留 7 天足矣,慢查询日志可保留 90 天。将保留期从 90 天降至 30 天,存储成本可降低 66%。仅索引必要字段 :每个索引字段会使存储翻倍。若从不在 SQL 中查询 http_user_agent,则无需为其建立字段索引。ARMS 启用采样 :高流量场景下,可仅追踪 10% 的请求。既能捕获异常,又将成本降至十分之一。聚合后再存储 :对于只需 5 分钟粒度的指标,应在应用层聚合后上报,而非推送每个请求的原始数据点。可观测性必须前置 :上线后再补的成本极高——需重构日志、补充追踪、重做仪表盘。应将 Logtail、CloudMonitor 代理和 ARMS 代理直接集成到实例初始化脚本中。三大支柱互补而非冗余 :指标发现异常(错误率飙升),日志定位问题(数据库超时),追踪根因分析(缺失索引导致全表扫描)。三者协同,方能高效排障。SLS 是瑞士军刀 :集日志采集、搜索、SQL 分析、仪表盘与告警于一体。掌握 search | SQL 查询模式,配合五大核心面板(QPS、错误率、P99 延迟、热门接口、状态码分布),可覆盖 80% 的故障排查场景。告警症状而非原因 :“5 分钟内错误率 > 1%”远比“CPU > 80%”有价值。务必设置持续阈值(3–5 个连续数据点),并为计划维护配置静音期。从最小可行监控起步 :Logtail 采集 Nginx 与应用日志,CloudMonitor 监控 ECS/RDS/SLB 基础指标,四条核心告警(错误率、CPU、磁盘、DB 连接),一个运维仪表盘。随着业务增长,再逐步引入 ARMS 追踪、自定义指标等高级功能。完美并非目标,能在站点宕机时及时通知你,才是可观测性的核心价值。下一篇我们将探讨容器化方案(ACK 与 SAE)。届时你会庆幸提前搭建了可观测体系——因为在缺乏集中日志的情况下调试 Kubernetes 集群,那将是一场噩梦。